
William’s Percent Range (WPR) is a popular momentum indicator used in technical analysis of the financial markets. It measures the current price in relation to the highest high and lowest low over a set lookback period, allowing traders to identify overbought and oversold conditions. In this comprehensive guide, we will explore everything you need to know about William’s Percent Range, how it works, and how to effectively use it in your forex trading.
What is William’s Percent Range?
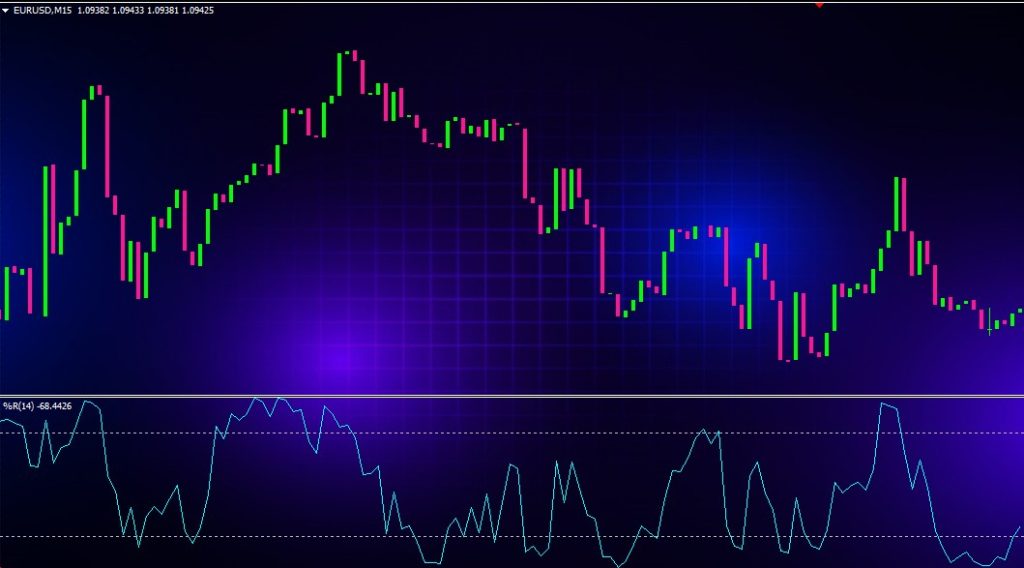
William’s Percent Range, commonly referred to as %R, is an oscillator that fluctuates between 0 and -100. It was developed by Larry Williams in 1976 and aims to determine overbought and oversold levels in the market.
The indicator calculates the current price in relation to the highest high over the lookback period (typically 14 periods) and the lowest low over that same timeframe. The %R formula is:
%R = (Highest High – Close) / (Highest High – Lowest Low) x -100
Where:
Highest High = The highest price over the lookback period
Lowest Low = The lowest price over the lookback period
Close = The current period’s closing price
As the formula shows, %R generates a value from 0 to -100. The indicator does not have upper limits, and readings above -100 or below 0 simply mean prolonged overbought or oversold conditions.
How Does William’s Percent Range Work?
William’s Percent Range works by comparing the current closing price to the highest high and lowest low over the specified lookback period. Typically, a 14-period setting is used for %R.
- Readings from 0 to -20 indicate the asset is overbought. This suggests the price may be due for a reversal or corrective pullback.
- Readings from -80 to -100 signal the asset is oversold. An oversold reading implies the price may be poised for a bounce higher.
- Readings from -20 to -80 represent neutral conditions and no clear trading signal.
As an oscillator that fluctuates between 0 and -100, William’s Percent Range is best suited for identifying overbought and oversold levels and potential reversals. Traders mainly use it to confirm trade signals given by other technical indicators.
Key Features of William’s Percent Range:
- Bounded Indicator – By fluctuating between 0 and -100, %R has clearly defined overbought and oversold levels making interpretation straightforward.
- Momentum Formula – Comparing the current close to high-low range gives traders a feel for momentum and identifies extremities.
- Versatility – %R can be applied to any freely traded asset across various time frames.
- Signal Line – Adding a signal line creates a visual trigger for trading signals. Common settings are 9-period EMA or SMA.
How to Use William’s Percent Range in Forex Trading
William’s Percent Range offers traders several strategies to profit from forex market opportunities. Here are some ways traders utilize %R:
Identify Overbought/Oversold Levels
The main use of %R is spotting when an asset is pushing into overbought or oversold territory. Readings above -20 indicate the price is becoming overextended to the upside. Readings below -80 signal the price is oversold and ripe for a bounce.
Traders look for %R reversals back below -20 for long signals and up above -80 for short signals after pullbacks. Conservative traders wait for the reversal to confirm before entering.
Trade Range Extremes
Aggressive traders will look to fade new extremes in William’s Percent Range. As %R pushes into new highs or lows, contrarian traders will bet on a reversal and enter in the opposite direction. This is considered an early signal and requires fast reaction.
For example, if %R drops to -90 (extreme oversold), a trader may buy the dip in anticipation of a corrective bounce higher. The trader would place a stop below the recent swing low.
Combine With Price Action
For even higher probability trades, %R signals can be combined with price action analysis. This could involve waiting for the price to break support or resistance before acting on overbought/oversold readings.
Some traders wait for candlestick patterns to form near %R extremes, like bullish engulfing candles on oversold readings. This enhances accuracy and improves risk management.
Use With Other Indicators
William’s Percent Range works best when used to confirm signals from leading indicators like moving averages, MACD, RSI or Bollinger Bands. As an example, a bullish MACD crossover plus an oversold %R reading could flag a high probability long setup.
Divergence between price and %R can also generate trade ideas. If price makes higher highs while %R makes lower highs, it indicates waning momentum and a potential reversal.
Scanner for Overbought/Oversold Levels
Traders will often use %R as part of broader technical analysis to scan for overbought or oversold assets across markets. This allows traders to build watchlists and narrow down high probability chart setups across various forex pairs.
William’s Percent Range Trading Tips and Strategies
When implemented properly, William’s Percent Range can be a valuable addition to any active trader’s toolbox. Keep these tips in mind to enhance effectiveness:
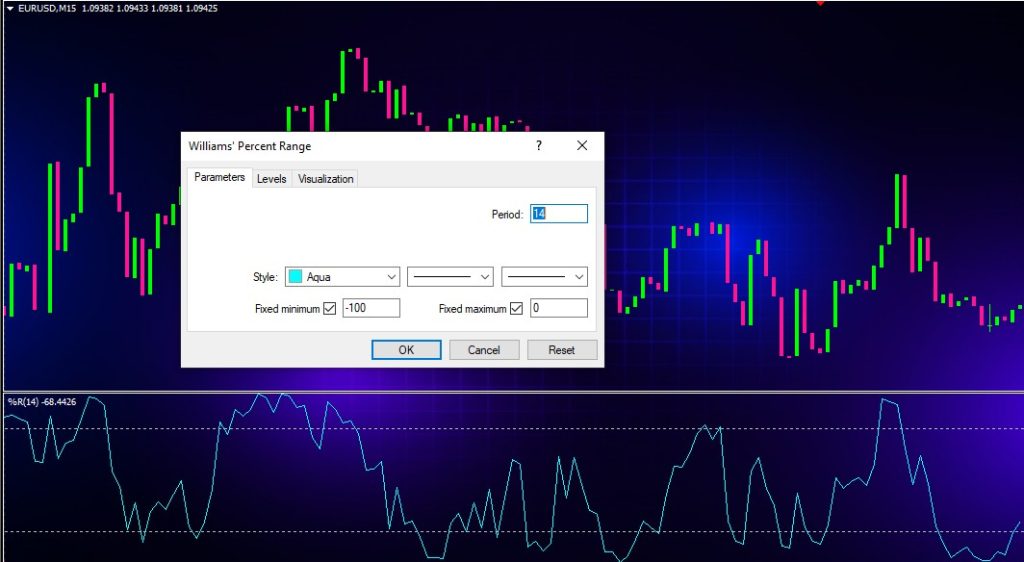
- Use the Default 14 Period Setting – The standard 14 periods captures the optimal amount of data for trading forex. Leave this as the default unless you have a specific reason to alter it.
- Vary Time Frames – Apply %R to weekly, daily and intraday time frames for a multi-timeframe perspective. Lower highs/lows on a higher time frame carry more significance.
- Focus on Extremes – Pay most attention to readings below -80 and above -20 and don’t expect sustained moves. Wait for clear reversals back inside range.
- Use a Signal Line – Adding a 9-period moving average line makes overbought/oversold crossovers more visually defined on the chart.
- Confirm With Price Action or Other Indicators – For the highest probability trades, require additional technical confirmation beyond just an overbought or oversold %R reading.
- Define Risk – Always utilize stops at recent swing highs/lows when trading signals. Define acceptable risk before entering trades.
William’s Percent Range vs Relative Strength Index (RSI)
William’s Percent Range is often compared to the Relative Strength Index (RSI) since they both measure momentum and overbought/oversold levels. Here are some of the key differences:
- Range – %R fluctuates between 0 and -100. RSI moves between 0 and 100.
- Formula – %R uses highest high and lowest low over lookback period. RSI uses relative average gains and losses.
- Overbought/Oversold – %R overbought above -20 and oversold below -80. RSI overbought above 70 and oversold below 30.
- Sensitivity – %R tends to be more sensitive with a higher number of crossovers. RSI offers smoother oscillation.
- Signals – Traders mainly use %R for reversals. RSI also utilized for trend continuations and failures.
Neither indicator is categorically better. William’s Percent Range offers a straightforward momentum range while RSI supplies smoother overbought/oversold trading signals. Many traders opt to use both indicators together.
Using William’s Percent Range in TradingView
William’s Percent Range comes standard on TradingView charts so implementation is quick and easy:
- Open the chart for the forex pair you want to analyze
- In the indicators window, type “%R” and select “Williams %R” from the dropdown
- Apply the default 14 period lookback setting initially
- Adjust the overbought and oversold horizontal lines to -20 and -80
- Optionally, add a 9 period moving average as a signal line
- Analyze potential trade signals when the oscillator crosses overbought/oversold boundaries or diverges from price
- Combine with other technical indicators for greater accuracy
The flexibility of TradingView allows traders to experiment with various %R settings and apply it across any instrument or time frame. Extensive customization options are available.
Conclusion
William’s Percent Range offers straightforward momentum analysis to identify overbought and oversold levels in the forex market. Traders mainly utilize the indicator to confirm trade signals provided by other technical tools. By looking for %R extremes heading into reversal zones, traders can profit from forex oscillation cycles. However, %R works best when combined with price action rules and risk management principles. Use William’s Percent Range to compliment your existing trading strategy.