
The stochastic oscillator is a popular technical analysis indicator traders use to analyze financial markets. This oscillator, developed in the 1950s by George Lane, analyzes market momentum and helps traders identify overbought and oversold conditions. The stochastic oscillator is displayed as two lines – %K and %D – that oscillate between 0 and 100. The %K line is more responsive while the %D line is a 3-period moving average of %K designed to smooth out the data.
What is the Stochastic Oscillator?
The stochastic oscillator is a momentum indicator that analyzes the closing price of an asset relative to the high-low range over a set period of time, typically 14 trading days.
The oscillator aims to determine when an asset has been overbought or oversold, allowing traders to identify potential entry and exit points in the market.
It was developed in the late 1950s by George C. Lane, a technical analyst who was investigating a way to determine when securities were overbought or oversold.
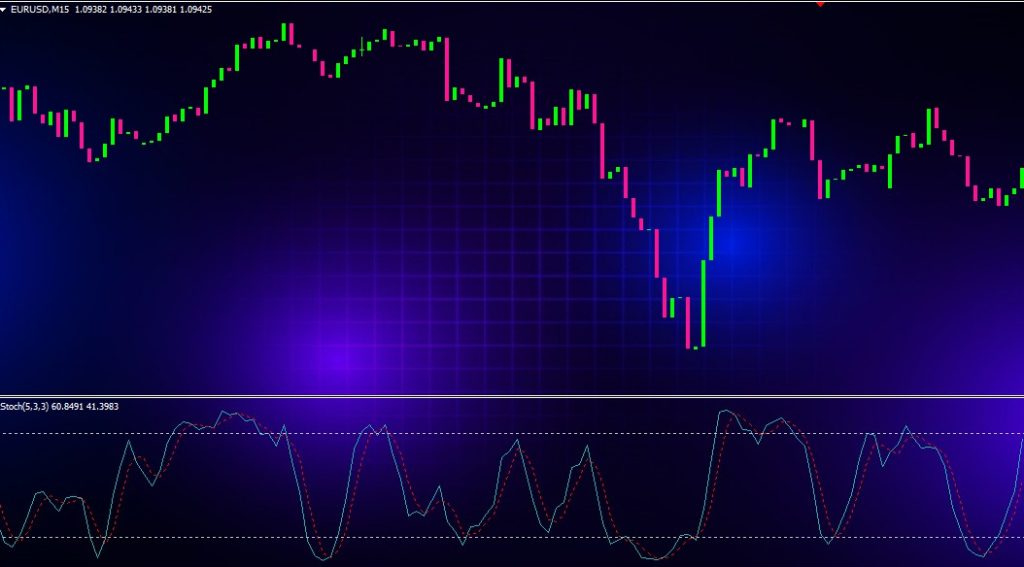
The stochastic oscillator is displayed as two lines that oscillate between 0 and 100 – a fast %K line and a slow %D line.
How the Stochastic Oscillator Works
The stochastic oscillator is calculated with this formula:
(Current Close – Lowest Low)/(Highest High – Lowest Low) x 100
The oscillator takes the current closing price, subtracts the lowest low over the lookback period, and divides that result by the total high-low range over the same period.
This final number is multiplied by 100 to convert it into a percentage or oscillator that moves between 0 and 100.
- A reading near 0 indicates the close was near the low for the period. This suggests an oversold condition.
- A reading near 100 indicates the close was near the high for the period. This suggests an overbought condition.
- Readings between 0 and 20 are considered oversold.
- Readings between 80 and 100 are considered overbought.
The default settings use the current close, the 14-period high-low range, and a 3-period simple moving average. Traders can adjust these parameters.
The D Line of the Stochastic Oscillator
The %D line is a 3-period simple moving average of the %K line. It’s purpose is to act as a signal or trigger line.
Because %D is slower than %K, it trails behind the faster %K line. When %K crosses above %D, it’s a bullish signal. When %K crosses below %D, it’s a bearish signal.
How to Use the Stochastic Oscillator for Trading
There are several ways traders use the stochastic oscillator for analyzing markets and identifying trading opportunities. Here are the most common methods:
Overbought/Oversold Levels
Looking for overbought and oversold readings is the primary way the stochastic is used.
When the oscillator moves above 80, the asset is considered overbought and likely to reverse lower. When it drops below 20, the asset is oversold and likely to bounce back up.
Traders watch for the oscillator to rise above 80 then turn down to signal an overbought condition and potential sell signal. A drop below 20 then a move higher signals an oversold condition and potential buy signal.
Crossovers
The %K and %D lines provide trading signals when they cross. As noted above:
- %K crossing above %D signals upward momentum and is bullish
- %K crossing below %D signals downward momentum and is bearish
Divergence
The stochastic oscillator also helps identify divergence from price action.
If prices are reaching new highs but the stochastic is showing lower highs, it indicates negative divergence and weakness that could foreshadow a trend reversal.
If prices are making new lows but the stochastic shows higher lows, it indicates positive divergence and strengthening that suggests a potential upside breakout.
Additional Filter
Since overbought/oversold readings above 80 and below 20 are frequent, traders often wait for additional confirmation before taking trades signaled by the stochastic.
A common filter is to require the stochastic to drop below 20, then cross back above for a buy signal, or rise above 80, then cross back below for a sell signal. This helps avoid whipsaws and false signals.
Stochastic Oscillator Strategies and Techniques
Here are some trading strategies utilizing the stochastic oscillator:
Overbought/Oversold Reversals
This straightforward strategy looks for trades when the stochastic oscillator reaches overbought or oversold levels then reverses direction.
- Enter long positions when the oscillator bottoms below 20 then crosses above 20
- Enter short positions when the oscillator peaks above 80 then crosses back below 80
Stop losses can be placed 2-3% below the entry price. Take profits on a stochastic crossover back below 20 or above 80.
Slow Stochastics Crossover
This method trades the crossover of the slow %D line.
- Buy when %K crosses above %D
- Sell when %K crosses below %D
Stochastic Divergence
Look for divergence between price and the stochastic oscillator. If a new price high or low isn’t confirmed by the stochastic, trade the anticipated reversal.
- New price highs without new stochastic highs signals a pending reversal lower from an overbought peak.
- New price lows without new stochastic lows signals a pending reversal higher from an oversold bottom.
Always use other indicators like volume and moving averages to confirm stochastic divergence signals.
Stochastic + MACD
Combining the stochastic with the MACD indicator can provide more reliable signals. Wait for both indicators to align before taking trades.
For example, buy when the stochastic crosses up from oversold levels and the MACD histogram ticks up from below its centerline. Sell when the stochastic crosses down from overbought levels and the MACD histogram ticks down from above its centerline.
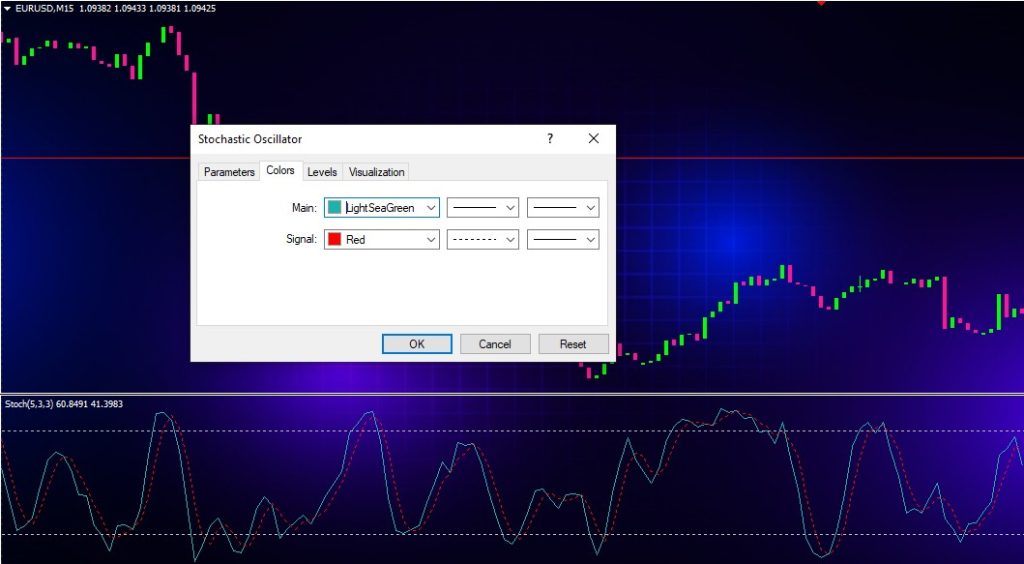
Stochastic Oscillator Settings
The standard stochastic oscillator has these default parameters:
- %K Periods: 14
- %K Slowing Periods: 3
- %D Method: Simple Moving Average
But traders can adjust these settings to suit their timeframe or trading style. Some other popular stochastic settings include:
Fast Stochastic – More sensitive with shorter lookback. Good for shorter timeframes.
- %K Periods: 5
- %K Slowing Periods: 3
Slow Stochastic – Less sensitive with longer lookback. Good for longer timeframes.
- %K Periods: 21
- %K Slowing Periods: 3
Full Stochastic – Eliminates smoothing to remove lag from %K and %D convergence.
- %K Periods: 14
- %K Slowing Periods: 1
Always test settings on historical data before using to find the optimal parameters for your strategy.
Stochastic Oscillator Best Practices
Here are some best practices to use when incorporating the stochastic oscillator into your trading:
- Combine with other technical indicators for confirmation before taking signals
- Be aware of ranging markets where overbought/oversold readings persist for long periods
- Adjust settings to match your timeframe (faster settings for shorter timeframes, slower settings for longer timeframes)
- Look for divergence with price to anticipate potential reversals early
- Wait for crosses back above/below 20/80 zones before acting on oversold/overbought readings to avoid false signals
- Use proper stop losses and risk management for any stochastic oscillator signals
- Test strategies and customize settings before using in live trading
The Benefits and Limitations of the Stochastic Oscillator
Benefits
- Quickly identifies overbought and oversold levels
- Confirms price momentum and trend strength/weakness
- Signals potential reversals via crossovers and divergence
- Oscillator adaptable through adjustable input settings
- Works well in both ranging and trending markets
Limitations
- Too many false signals and whipsaws if used alone
- Lagging – not useful for timing market entries
- Subject to repainting since it relies on future data
- Bounces from 0/100 extremes are unpredictable
- Prone to giving false divergence signals
Traders should combine the stochastic with other indicators and analysis techniques to reap the benefits while avoiding the drawbacks when using it for trading decisions.
Stochastic Oscillator vs. RSI
The stochastic oscillator is often compared to the Relative Strength Index (RSI) since they both measure overbought/oversold conditions and oscillate between 0 and 100. So what’s the difference?
The main differences between the stochastic and RSI are:
- Components – The stochastic uses the current close, high and low. The RSI only uses the current close and previous close.
- Overbought/Oversold – The stochastic is overbought above 80 and oversold below 20. The RSI is overbought above 70 and oversold below 30.
- Signal Line – The stochastic has a built-in signal line (%D). The RSI doesn’t have a separate signal line.
- Divergence – The stochastic highlights divergence more clearly. Divergence is harder to spot on the RSI.
- Sensitivity – The stochastic is more sensitive to minor price changes since it incorporates the high-low range.
So while their objectives are similar, the stochastic oscillator provides unique benefits to complement the RSI or other indicators. Many traders use both in their analysis.
Stochastic Oscillator Trading Tips
Here are some useful tips when it comes to effectively utilizing the stochastic oscillator:
- Use longer timeframes (hourly, 4-hour, daily) to avoid excessive false signals
- Start with standard settings (14,3,3) then optimize as needed for your strategy
- Increasing K periods smoothes the oscillator to filter out noise
- Decreasing D periods makes crossovers more sensitive
- Combine with other indicators (moving averages, MACD, RSI, etc.) for confirmation
- Look for divergence to anticipate potential trend changes early
- Wait for closes outside bands before acting on overbought/oversold signals
- Consider volume, support/resistance for additional trade context
- Use stochastic for trade entry signals, not precise market timing
Adjusting the inputs and finely tuning strategies takes practice, but the stochastic oscillator is a versatile trading tool when used properly.
Examples of Stochastic Oscillator Signals
Let’s look at some real chart examples to see the stochastic oscillator in action:
Overbought Crossover Sell Signal
Here the stochastic peaked above 80 before turning down, signaling overbought conditions. The stochastic %K line then crossed below the %D line, triggering a sell signal.
Oversold Crossover Buy Signal
In this case, the stochastic dropped below 20 into oversold territory before hooking back up. The %K line moved above the %D for a bullish crossover buy signal.
Bullish Divergence
This chart shows the price reaching a lower low while the stochastic formed a higher low – bullish divergence. This hinted at building momentum and preceded an upside breakout.
Bearish Divergence
Here the price reached a higher high but the stochastic formed a lower high for bearish divergence. This suggested waning momentum and a reversal signaled by the stochastic crossover.
These examples demonstrate how traders can spot and take advantage of stochastic signals when they occur.
Stochastic Oscillator Strategy
Putting it all together, here is a simple swing trading strategy using the stochastic oscillator:
Entry Rules
Buy when:
- The stochastic %K line crosses above 20 signaling an oversold bounce
- %K then crosses above %D for bullish confirmation
Sell when:
- The stochastic %K line crosses below 80 signaling an overbought reversal
- %K then crosses below %D for bearish confirmation
Exit Rules
- Set a stop loss 2-3% below the entry price
- Take profit when stochastic reaches overbought/oversold zone again
- Exit partial position on stochastic crossover back below/above 20/80
- Move stop to breakeven after 2x risk reward reached
Money Management
- Risk 1-2% of account per trade
- Scale position size based on stop distance
- Limit trades to higher timeframe (4H, daily, weekly) setups
Follow this plan consistently with good risk management and it can produce solid profits over time.
The stochastic oscillator is a versatile indicator that can detect momentum, overbought/oversold levels, and gauge trend strength. By combining it with other analysis methods, traders can develop reliable and profitable forex trading strategies.
Conclusion
The stochastic oscillator is a momentum indicator that identifies overbought and oversold conditions in the forex market. While it has some drawbacks, the stochastic provides useful trade signals when combined with other indicators and analysis techniques.
Use the stochastic to confirm potential reversals at extremes, spot divergences with price, and provide additional insight into forex trends. Adjust the settings based on your trading timeframe and goals.
Implementing trading strategies based on the stochastic oscillator with good risk management can give traders an edge. However, always practice caution with any indicator signals before risking real capital.
By following the guidelines outlined in this stochastic oscillator guide, forex traders can take advantage of this tool to improve their market timing and trading performance.