

Bollinger Bands are one of the most popular technical indicators used by forex traders today. This versatile indicator was created in the 1980s by famous technical analyst John Bollinger and it continues to be widely used to analyze markets and identify potential trading opportunities.
What Are Bollinger Bands?
Bollinger Bands are a type of statistical chart indicator that plots variable width bands on either side of a price chart. The bands will expand and contract as price action changes, creating a visual representation of volatility.
Here’s an example of how Bollinger Bands look on a forex chart:
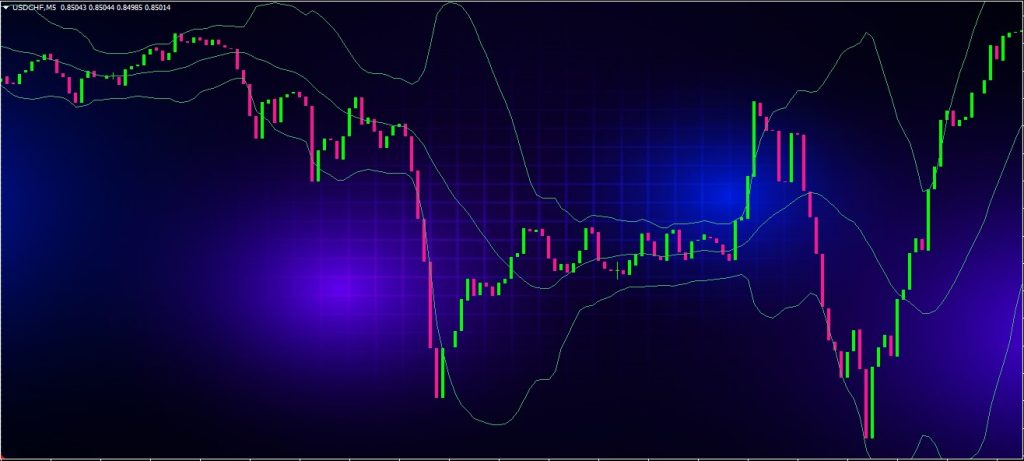
The main components of Bollinger Bands include:
- Middle Band – The middle band is a simple moving average typically set to 20 periods. This acts as the baseline.
- Upper Band – The upper band plots a certain number of standard deviations above the middle band, often 2 standard deviations.
- Lower Band – The lower band plots the same number of standard deviations below the middle band.
- Bandwidth – The distance between the upper and lower bands. This measures volatility.
Bollinger Bands adjust dynamically to current market conditions. When volatility increases, the bands widen and move further apart. During less volatile periods, the bands contract and move closer together.
This unique characteristic makes Bollinger Bands an adaptive indicator that provides visually helpful signals regarding overbought and oversold levels.
Now let’s look at how Bollinger Bands are calculated.
How Are Bollinger Bands Calculated?
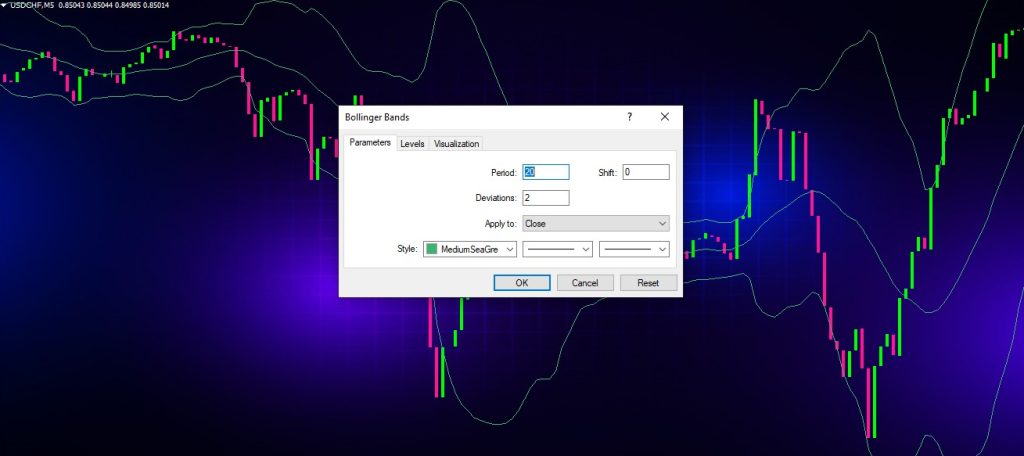
The formula behind Bollinger Bands seems complicated but can be broken down into a simple step-by-step process:
- First, calculate a simple moving average (SMA) over a certain period. The standard setting is 20 periods. This becomes the middle band.
- Next, measure the standard deviation of the same data used for the SMA.
- Plot lines above and below the SMA at a distance of 2 standard deviations. This establishes the upper and lower bands.
- As new periods emerge, the bands will widen and contract based on the new standard deviation.
Traders typically use a 20 period SMA for the middle band and 2 standard deviations for the outer bands. However, the inputs can be adjusted based on personal preferences and trading style.
For example, more volatile instruments like crypto may benefit from wider bands of 3 standard deviations. Short term traders can experiment with faster settings like a 10 period SMA.
The default 20/2 settings work well for most markets and time frames. Now let’s see how traders actually put Bollinger Bands to use in their analysis.
How Traders Use Bollinger Bands
The unique ability of Bollinger Bands to dynamically adapt to changing market conditions makes them a versatile indicator suited to many different trading strategies. Here are some of the most common ways traders use Bollinger Bands:
Identifying Overbought/Oversold Levels
One of the core benefits of Bollinger Bands is visualizing when an instrument may be overextended to the upside or downside.
When price touches the upper band, the market can be considered overbought. When price touches the lower band, the market may be oversold.
However, this doesn’t necessarily mean you automatically buy the lows or sell the highs. Bands can remain wide during strong trends. It’s best to combine bands with other indicators.
But Bollinger Bands still provide helpful clues regarding historically high or low prices. Divergences between price and bands aid in confirming trend reversals.
Determining Trend Direction
The 20-period SMA at the heart of Bollinger Bands provides a clear medium term trend line.
When price is above the middle band, the prevailing trend is up. When price is below the middle band, the main trend is down.
The angle of the bands also gives clues about the trend. Upward sloping bands signal an uptrend. Downward sloping bands indicate a downtrend.
Quantifying Volatility
As noted earlier, the distance between the upper and lower bands demonstrates current volatility conditions.
Wider bands show increased volatility and more price fluctuation. Narrow bands indicate low volatility as prices consolidate.
Monitoring bandwidth gives helpful context about volatility, which can be factored into trade size and risk management. Periods of high volatility may call for smaller position size.
Spotting Breakouts
The upper and lower Bollinger Bands often act as support and resistance levels. A decisive break above the upper band or below the lower band can signal continuation of a trend.
These breakouts confirm the strength of the ongoing trend. Breakouts combined with other indicators like volume give traders greater confidence entering new positions in the dominant direction.
Identifying Reversals
In addition to breakout trades, reversals are also commonly traded with Bollinger Bands.
Wicked candlestick rejections off the upper or lower bands indicate the trend may be exhausting itself. Divergences between price and band contact points also signal potential trend reversals.
A move back inside the bands after a period of expansion is another sign of an impending trend reversal. The key is being patient for confirmation signals rather than blindly trading every band touch.
Determining Entry & Exit Points
Bollinger Bands provide visually helpful information for planning entries and exits. Traders often use the moving average as a dynamic support or resistance line for new entries.
Closing a trade when price touches the opposite band is another common technique. Stop losses can also be placed above or below the bands to allow for volatility expansion.
Overall, Bollinger Bands give traders clear visual markers for planning risk management and timing trades. Combined with indicators like the RSI, bands become even more powerful.
Now that we’ve covered the standard techniques, let’s look at some advanced strategies for further optimizing bands.
Advanced Bollinger Band Trading Strategies
The beauty of Bollinger Bands is their versatility. The standard settings of 20/2 serve well for most traders. But with some fine tuning and creativity, there are many advanced ways to use bands.
Here are some advanced tips and techniques:
Add Bandwidth Indicator
While you can visually see bands expand and contract, adding a bandwidth indicator quantifies this volatility. The bandwidth measures the distance between upper and lower bands.
Bandwidth above the average indicates periods of high volatility. Readings below average signal consolidation and decreased volatility. Monitoring bandwidth helps identify optimal trading conditions.
Customize the MA Period
A 20 period SMA is standard, but you can experiment with faster or slower settings. For example, a 10 period SMA will be more responsive for short term trading. 50 or 200 period SMAs work better for long term positions.
Don’t be afraid to test different MA periods to match your strategy. Just be sure to adjust the standard deviation inputs accordingly.
Tweak the Standard Deviations
The default 2 standard deviation parameters are a solid starting point. Yet adjusting the standard deviation multiples gives you more customizable bands.
Try widening bands to 2.5 or 3 standard deviations for more volatile markets. Narrow the parameters to 1.5 for slower moving stocks or indices. Wider bands allow more volatility before a breakout.
Use Envelopes Around Other Indicators
Bollinger Bands don’t have to plot around a simple moving average. You can add upper and lower bands around other indicators like RSI or MACD.
Band envelopes around indicators help identify overbought/oversold readings. They also highlight divergences just like normal price bands. Get creative!
Focus on Reversals
For countertrend traders, Bollinger Bands excel at identifying exhausted trends and reversals. Monitor for candlestick rejections off the bands and divergence signals between price and bands.
Also watch for volume to decrease as price tags the outer bands. Low volume band touches are less meaningful. High volume rejection candles signal reversals.
Use Bands on Higher Timeframes
Don’t limit your use of Bollinger Bands to lower timeframes when day trading. Applying bands to the daily, weekly or even monthly charts provides helpful macro trend context.
Reference longer term bands to understand the prevailing trend and identify large breakout opportunities. Zoom out for perspective!
These advanced adjustments show the depth of Bollinger Bands. A few thoughtful tweaks can greatly improve their potency. Just remember to backtest before using any new techniques in live trading.
Now let’s walk through a real chart example applying some of these strategies.
As you can see, Bollinger Bands highlighted several profitable opportunities on this currency pair. This example illustrates their versatility across different types of trades.
Key Takeaways on Bollinger Bands
Here are some of the main points to remember about Bollinger Bands:
- Bollinger Bands plot envelope bands around a moving average based on standard deviation. This creates a volatility-based envelope around price.
- Bands adapt dynamically to changing market conditions. Volatility causes expansion. Consolidation leads to contraction.
- Monitor band touches to spot overbought/oversold levels and potential reversal points. Breakouts occur with decisive band penetrations.
- Factor band width/bandwidth into your analysis to quantify volatility. Wider bands show higher volatility.
- Divergences between price and bands indicate trend shifts. Candlestick rejections off bands also flag reversals.
- Try fine-tuning the period/standard deviation inputs or applying bands to other indicators like RSI.
- Combine Bollinger Band analysis with other indicators like volume and trendlines to confirm high probability trades.
Now you have a solid foundation for putting this powerful indicator to work in your own trading. Let’s wrap up with some final thoughts.
Conclusion
John Bollinger’s famous technical indicator has stood the test of time. Three decades later, Bollinger Bands remain a staple tool relied upon by forex, stock, crypto, and CFD traders worldwide.
By dynamically adapting to changing market conditions, Bollinger Bands help traders quantify volatility and identify high probability trade entries and exits.
Remember, bands should not be used alone. Combine them with other strategic signals like candlesticks, momentum oscillators, volume, and chart patterns.
Bollinger Bands are the perfect complement to any trader’s existing approach. Add them to your own trading toolkit and see if bands can take your technical analysis to the next level.
Thanks for reading! Please share any comments, questions, or your own Bollinger Band techniques below.