
The accumulation/distribution indicator (A/D) is a powerful yet often overlooked technical analysis tool used by forex traders. This indicator analyzes price and volume data to determine if a stock or currency pair is being accumulated (bought) or distributed (sold). It can give key insights into the strength or weakness of trends, potential reversals, and the psychology behind market moves.
What is the Accumulation/Distribution Indicator and How Does it Work?
The accumulation/distribution indicator was created in the early 1980s by famous market technician Marc Chaikin. It is based on the premise that the strength of a trend can be determined by analyzing the flow of volume into and out of a security.
The indicator seeks to determine if traders are generally “accumulating” (buying) or “distributing” (selling) a currency pair during a given period. An increase in accumulation over time typically signals that an uptrend is strengthening, while distribution points to a weakening downtrend.
Here is how the A/D indicator is calculated:
A/D = ((Close – Low) – (High – Close)) / (High – Low) x Period’s Volume
The first part of the formula ((Close – Low) – (High – Close)) is called the Money Flow Multiplier. This calculates the level of buying pressure for that period – a positive number indicates more buying than selling.
This Money Flow Multiplier is then divided by the high-low range to normalize the data.
Finally, this normalized money flow is multiplied by the volume for that period to give the final A/D value. The A/D combines both price action and volume data into one key indicator of the accumulation or distribution for that period.
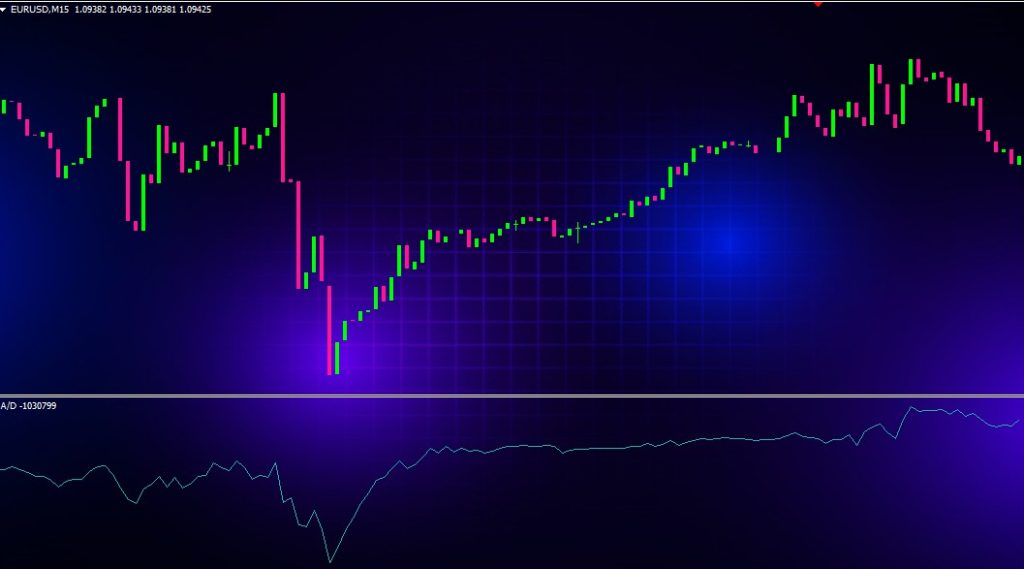
The indicator displays as an oscillator that fluctuates above and below a zero line. The movements above and below this equilibrium level show when trading volume is entering (accumulation) or leaving (distribution) the market.
As the A/D value builds and rises over time, it shows increased accumulation that signals an uptrend is strengthening. When the indicator falls consistently, it points to distribution and a weakening of the current downtrend.
Traders can analyze the A/D oscillator just like other indicators, looking for crossovers, divergences, overbought/oversold levels, and spikes in momentum. The core strategies are comparing A/D signals to the direction of the underlying price trend.
Let’s look at some examples of how to interpret the accumulation/distribution oscillator in practice.
Interpreting the Accumulation/Distribution Indicator and Identifying Trading Opportunities
When analyzing any currency chart using the A/D indicator, the first step is confirming the direction of the major trend. The A/D works best when used in line with the major trend – either confirming continuations or signaling potential reversals.
Here are the key things to look for:
In Uptrends
- The A/D line is consistently rising over time
- The A/D shows regular spikes above the zero line
- New highs in price are confirmed by higher highs in the A/D oscillator
- The A/D line crosses above its moving average
- Divergence between price and A/D, with price making new highs but A/D failing to confirm, signals potential reversal
In Downtrends
- The A/D line is steadily falling over time
- The A/D remains below the zero line for extended periods
- New lows in price match lower lows in the A/D
- Crosses of the A/D line below its MA line confirm the downtrend
- Divergence between price and A/D, with lower lows in price but A/D failing to confirm, points to potential trend reversal
In Trading Ranges
- The A/D oscillator fluctuates near the zero line lacking a defined trend
- The A/D line crosses above and below its moving average frequently
- Price and indicator may show divergence signalling larger moves ahead
With Reversals
- Price and A/D diverge such as price reaching new high but A/D failing to confirm
- The A/D line crosses its moving average in the opposite direction of the larger trend
- The A/D breaks its previous high or low ahead of the price action
- Pivots in the A/D line signal changes from accumulation to distribution or vice versa
The key with the A/D indicator is combining it with the overall trend analysis using moving averages and support/resistance. Divergences and crossovers between the indicator and price action often precede bigger moves.
Now let’s look at using the A/D oscillator together with other indicators to confirm trading signals.
Combining Accumulation/Distribution with Other Technical Indicators and Strategies
The accumulation/distribution line is most powerful when combined with other forms of technical analysis to confirm trading signals. Some of the best indicators to use with A/D include:
Moving Averages
Comparing the A/D line to various moving averages helps identify crossover signals and divergences. Plot the A/D along with its 3-period, 10-period and 20-period moving averages.
Oscillators like RSI, Stochastics, MACD
Look for divergences between oscillators like RSI and the A/D indicator. Also look for crossovers such as the A/D crossing above its signal line.
Candlestick Patterns
Use A/D to confirm bullish or bearish engulfing patterns, doji reversals, piercing lines etc. A/D should move in same direction as the candlestick signal.
Support/Resistance
Look for the A/D line to peak near resistance levels and bottom near supports in the direction of the larger trend.
Fibonacci Retracements
During pullbacks, the A/D line often finds support or resistance around Fibonacci retracement levels, especially the 50% and 61.8% levels.
Volume
Compare the rise and fall of the A/D indicator to volume bars – increased trading activity should match increased accumulation or distribution.
Other Momentum Indicators
Look for agreement between the A/D line and other momentum oscialltors like the CMF, OBV or PVT to confirm signals.
Here are some example trading strategies combining A/D with other indicators:
Moving Average Crossover
Go long when the A/D line crosses above its 20-period MA in an uptrend. Exit longs when the A/D crosses back below its MA. Reverse this for short trades.
**A/D and RSI Divergence **
Look for bearish divergence with price making a higher high but A/D and RSI failing to confirm. Enter short on break of support.
A/D with Candlestick Patterns
Confirm bullish engulfing and piercing line reversals with a crossover of the A/D line above its signal line. Ride the reversal trend.
A/D Peak with Resistance
In an uptrend, look for the A/D line to surge and peak near key resistance levels – then trade the subsequent pullback/reversal.
The key is not relying on just the A/D indicator on its own, but combining its signals with other forms of technical analysis for higher probability setups. The A/D is an extremely powerful tool when used together with chart patterns, support/resistance levels, moving averages, volume, and other indicators.
Now let’s take a look at some of the key advantages of using accumulation/distribution in forex trading.
The Advantages of Using the Accumulation/Distribution Indicator
Here are some of the main benefits and strengths of using the A/D indicator:
- Confirms trend strength – Rising A/D shows increasing buying pressure that confirms uptrends. Falling A/D shows selling pressure and weakening downtrends.
- Warns of reversals – Divergences between price and A/D often foreshadow trend reversals.
- Incorporates volume – Most indicators only analyze price data. A/D incorporates critical volume data to show accumulation vs. distribution.
- Smooth oscillator – The indicator formulas smooth out the data into a flowing waveform that is easy to analyze visually.
- Universal application – The A/D works equally well on stocks, forex, cryptocurrency, and any liquid markets with volume data.
- Objective interpretation – The A/D line clearly shows buying vs. selling pressure making analysis more objective.
- Early signal of breakouts – The A/D will often break its own highs/lows foreshadowing new breakouts.
- Easy to combine – The indicator complements other forms of technical analysis and combines well into trading systems.
- Works across timeframes – The A/D indicator can be used on 1-minute charts up to weekly and monthly timeframes.
In summary, the A/D indicator gives traders an edge by confirming the strength of trends, warning of reversals, and providing an objective measure of buying and selling activity. When combined properly with other signals, it can significantly improve trading performance.
However, there are some limitations traders should be aware of when using this indicator.
The Disadvantages and Limitations of Accumulation/Distribution
While the A/D indicator is a powerful tool, it does have some drawbacks and limitations to keep in mind:
- Lagging indicator – Like all technical indicators based on past data, the A/D is inherently lagging. There is often a delay in signals.
- Signal noise – Too much focus on minor movements in the A/D line can lead to false signals and whipsaws. Larger trends are more important.
- Volume fluctuations – Surges in trading volumes can skew signals. Always filter signals with price action analysis.
- No definitive signals – The A/D line movements are open to interpretation. Divergences don’t always lead to reversals for example.
- Rangebound markets – Trendless trading ranges make interpreting the A/D line much more difficult overall.
- Requires volume data – The indicator doesn’t work on price data alone. Volume numbers must be available for its calculation.
- Inverse ETFs – The normal interpretations don’t work as well with inverse or leveraged ETFs. Use with caution.
The key is being aware of these limitations and combining the A/D with other confluence factors to avoid whipsaws. Never use A/D signals on their own to make trading decisions. Additional confirmation from price action, indicators, or chart patterns is essential.
Now let’s move on to tips for effectively applying accumulation/distribution in your own forex trading.
Tips and Tricks for Using Accumulation/Distribution
Here are some key tips for getting the most out of the A/D indicator in forex trading:
- Start with the larger trend first – determine if prices are in an uptrend, downtrend or range before applying A/D analysis.
- Smooth the data with a moving average – plot a 10-20 period MA on the A/D line to see clearer directional moves.
- Use longer timeframes for signals – the daily or weekly A/D gives more reliable signals. Shorter charts add noise.
- Focus on divergences – look for price/A/D divergences as the most powerful reversal predictors.
- Combine with other indicators – confirm A/D signals using oscillators, moving averages or chart patterns for better accuracy.
- Watch for crossover signals – the A/D crossing its MA often marks trend reversals or resumptions early.
- Note volume surges – unusually large trading volumes can quickly skew the A/D indicator.
- Be wary in low volatility markets – tight trading ranges make interpreting signals much more difficult.
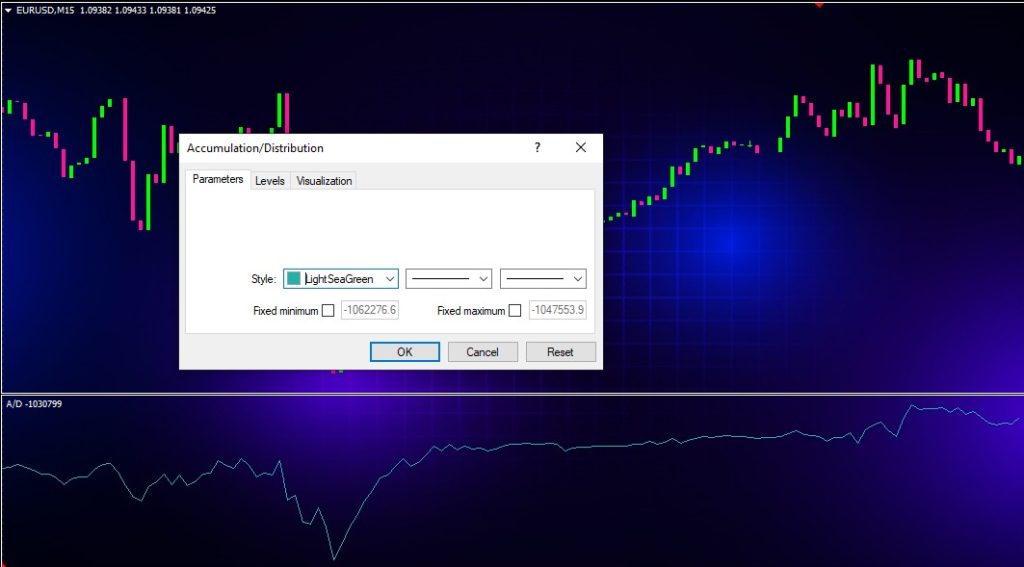
- Adjust settings for each timeframe – optimize A/D parameters like length of moving average for specific chart timeframes.
- Use on multiple currency pairs – compare A/D signals across various forex pairs and key indices for consensus.
Getting the most out of the A/D indicator requires combining it with a structured and robust trading approach. Always stick to high probability setups, use proper risk management on every trade, and target favorable reward:risk scenarios.
Conclusion: A Versatile Tool for Forex Traders
The accumulation/distribution indicator ultimately provides an objective, volume-based approach to confirming trends and identifying potential turning points and breakouts. It visualizes the vital accumulation vs. distribution dynamic in an intuitive oscillator format.
However, blindly following A/D signals often leads to whipsaws and false trades. The real power comes from combining indicator crossovers, divergences, volume analysis and chart pattern recognition with the A/D for high probability setups.
Used to its full potential, the accumulation/distribution indicator can provide a potent edge in forex trading from top to bottom. Just be sure to employ it with proper confirmation, money management, and a structured trading plan.
The A/D indicator belongs in every forex trader’s toolbox and can greatly enhance technical analysis when applied correctly. Take time to learn its nuances and incorporate it into your broader trading strategy. With the right approach, the A/D oscillator will provide many profitable opportunities on the forex market for years to come.