
The moving average is one of the most popular and widely used technical indicators in stock trading and analysis. A moving average, also known as MA, helps smooth out price fluctuations to show the underlying trend and momentum of a stock or security. Traders use moving averages to identify possible market trend direction changes and to determine support and resistance levels.
What is a Moving Average Indicator?
A moving average (MA) indicator displays the average closing price of a stock over a set time period. Moving averages are lagging indicators, meaning they follow price action rather than predict it. The indicator smooths out fluctuations in price to make it easier to identify overarching trends and filter out daily volatility.
Moving averages work by calculating the average closing price of a stock over a predetermined lookback period and plotting the result as a line on a price chart. As new closing prices emerge, the oldest data points are dropped from the average and the newest prices are added. In this way, a moving average constantly updates itself based on the most recent trading activity.
The two most common types of moving averages are simple moving averages (SMA) and exponential moving averages (EMA). An SMA calculates the arithmetic mean of a stock’s closing price over X number of periods. The EMA applies more weight to the more recent prices to reflect changes quickly. Typically, shorter moving averages are more responsive to price changes while longer MAs represent long-term trends.
How Moving Averages Work
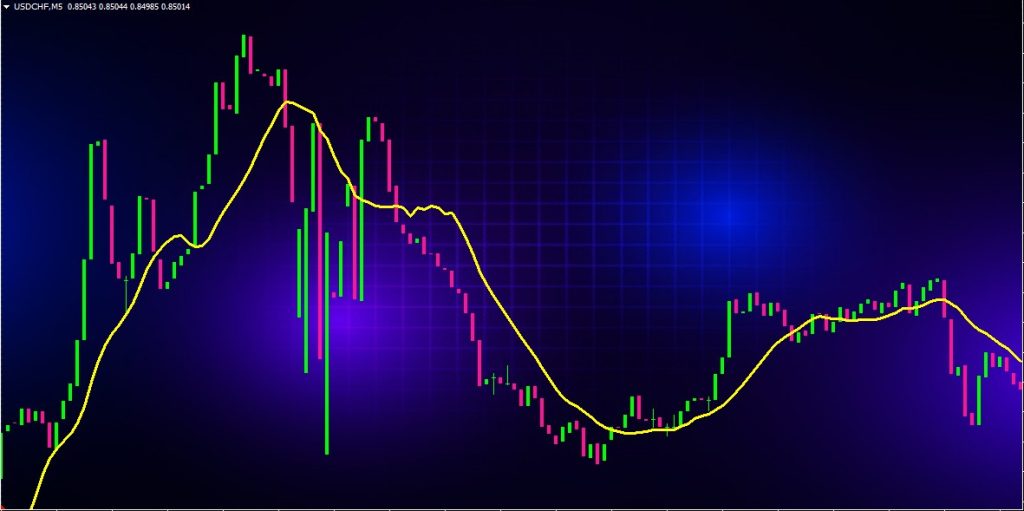
A moving average indicator takes historical price data over a set lookback period, averages it, and plots it as a line on the price chart. This line follows the price action, acting as a type of dynamic support or resistance level.
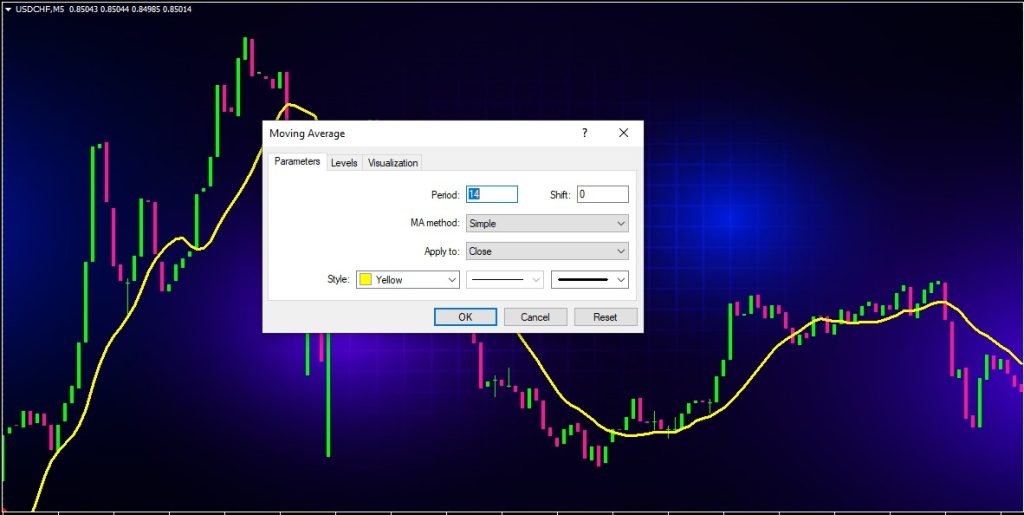
Here is a step-by-step look at how a simple moving average is calculated:
- Select the time period for the MA (10, 20, 50, 100, 200 days are common)
- Add up the closing prices from the most recent X number of periods
- Divide the sum by X to get the average closing price for that period
- Plot the new average as a point on the chart
- Repeat steps 2-4 for each new period, dropping the oldest data point
- Connect the averaged points to create the moving average line
As new periods emerge, the SMA constantly updates to reflect the latest prices. Older data is dropped while newer prices are incorporated. The moving average line will follow and react to changes in the trend.
EMA vs SMA
The exponential moving average applies weighting factors to give priority to recent closing prices. The EMA multiplies each closing price by a percentage the total sum, with the most recent day at the highest percentage. This allows the EMA line to react faster to price swings.
The SMA treats all closing prices over the lookback period equally. This makes it slower to respond to price changes but also less prone to whipsaws. Traders use a combination of EMAs and SMAs to gauge both short and long term trends.
Why Use Moving Average Indicators?
There are several key benefits to using moving averages in technical analysis:
- Identify Trend Direction – The slope of the MA indicates whether prices are trending up, down, or sideways. Rising moving averages reflect an upward trend while falling MAs signal a downtrend.
- Determine Support & Resistance – Moving averages often act as dynamic support and resistance. A MA can provide bounce points where a stock is likely to reverse off of.
- Smooth Out Price Action – The averaging of prices filters out market noise and volatility to reveal the underlying trend. MAs make it easier to analyze price charts.
- Generate Trading Signals – Crossovers, convergences and divergences between MAs and price can produce buy and sell signals for traders.
- Define Market Psychology – Whether prices are above or below key MAs indicates the prevailing market sentiment and momentum.
- Objective Measure – Moving averages are based on clearly defined mathematical calculations, not subjective interpretations.
Types of Moving Averages
There are many different types of moving averages that are distinguished by the length of the time period measured and the way the average is calculated. Common moving averages include:
Simple Moving Average
The simple moving average (SMA) is the most basic MA type. As discussed earlier, the SMA calculates the arithmetic average of closing prices over a set number of periods. It weighs all prices equally in the lookback period.
Popular SMA Timeframes
- 50 and 200 SMAs – Widely used for assessing long-term trends lasting months to years
- 20 and 100 SMAs – Represent near-term and medium-term trends lasting weeks to months
- 10 and 30 SMAs – Useful for gauging short-term momentum over days to weeks
Exponential Moving Average
The exponential moving average (EMA) gives more weighting to recent closing prices in its calculation. This allows it to react faster to price changes than a similarly set SMA.
Common EMA Timeframes
- 20 and 50 EMAs – Respond quickly to price swings making them good trend indicators
- 10 and 30 EMAs – Very sensitive to price changes and good for spotting reversals
Adaptive Moving Average
The adaptive moving average (AMA) allows the smoothing period to vary based on market volatility and trend. During calmer trading periods, more data is incorporated producing a slower MA. During volatile markets, the AMA reacts faster by giving more weight to recent prices. This flexibility helps it reflect changing market conditions.
Weighted Moving Average
The weighted moving average (WMA) also gives extra emphasis on the latest data points. However, instead of using percentages, the WMA applies a linear weight on prices giving the highest value to the most recent period. The WMA reacts faster than an SMA but slower than an EMA.
Volume Weighted Average Price
The volume weighted average price (VWAP) indicator incorporates both closing price and trading volume into its calculation. The VWAP places greater importance on periods with heavier volume. This makes it useful for assessing intraday trends.
Moving Average Trading Strategies
Moving averages are extremely versatile indicators. There are many ways traders can incorporate MAs into an overall trading approach, including:
Trend Identification – Use the slope and relationship of MAs to determine if the market bias is up, down or sideways. For example, rising 50 & 200 SMAs reflect an uptrend.
Crossovers – Buying when a shorter MA crosses above a longer MA shows upside momentum is building. The opposite crossover signals a potential reversal to the downside.
Dynamic Support/Resistance – Look to buy dips at rising MAs and take profits near falling MAs. MAs often act as support and resistance.
Convergence/Divergence – When price and the MA converge it signals the trend is accelerating. Divergence hints the trend may be ending as price diverges from the MA.
Multiple Timeframes – Comparing MAs on daily, weekly and monthly charts provides perspective. Focus on longer timeframes for major trend and shorter for reversals.
Combining with Other Indicators – Use with RSI, MACD, Bollinger Bands, etc. for confirmation. MAs work well as part of a complete system.
Moving Average Trading Rules
While past performance never guarantees future results, traders can follow some general rules and guidelines when using moving averages:
- Long MA above short MA = Uptrend, buy dips
- Long MA below short MA = Downtrend, sell rallies
- Price above MA = Bullish bias, look to buy pullbacks
- Price below MA = Bearish bias, look to short bounces
- MA flattening = Potential trend change ahead
- MA crossovers signal shifts in momentum
- Large price moves above/below MAs signal strength
Pay attention when price diverges from the MA – it often precedes a reversal. Use longer MA timeframes for major trend and add shorter MAs to confirm signals.
Common Moving Average Mistakes
While powerful indicators, moving averages do have some drawbacks traders should be aware of:
- Lagging – All MAs lag price action to some degree as they rely on old data. This means signals come late, often after much of the move has occurred.
- Whipsaws – During trading ranges, moving averages often produce false signals as price oscillates around the MA. Too much smoothing causes excessive whipsaws.
- Repainting – Moving averages are recalculated with each new period which can cause the line to shift right on charts.
- Subjectivity – Picking the “right” MA periods and types is largely subjective. Optimizing MAs to past data often leads to poor future results.
Avoid these mistakes by combining MAs with leading indicators, using multiple timeframes, and focusing on the bigger trend rather than overreacting to daily noise and volatility. Patience and discipline are key.
Moving Average Conclusion
Moving averages are a simple yet powerful technical indicator that every trader should understand. When used properly, MAs can help define the trend, spot potential reversals ahead of time, identify support and resistance levels, and generate trading signals and opportunities.
By combining MAs of different timeframes and types, traders can gain insight into both short-term and long-term trends and momentum shifts. Mastering moving averages takes practice and experience, but it is one of the best ways to improve overall market timing and performance.