
Fractals are a powerful technical analysis indicator used widely by forex and stock traders looking to identify key support and resistance levels. This comprehensive guide will explain what fractals are, how they are calculated, and how to effectively use fractal analysis for smarter trading decisions.
What Are Fractals and How Do They Work?
A fractal is a repeating pattern that can be found throughout nature, such as the branching structure of trees or the contours of mountains. In technical analysis, a fractal is a five-bar formation that signals potential support and resistance levels.
The fractal indicator was developed by noted technical analyst Bill Williams in the 1990s. It is based on the idea that markets move in predictable patterns that repeat across all timeframes. Traders can identify these fractals across daily, weekly or monthly charts to uncover key levels that are likely to be retested.
There are two types of fractals – bullish and bearish:
Bullish Fractals
A bullish fractal forms with a five-candle sequence where the lowest low is preceded by two lower highs and followed by two higher lows. The middle candle’s low marks a potential support level on the chart.
Bearish Fractals
A bearish fractal is made up of a five-candle sequence where the highest high is preceded by two higher lows and followed by two lower highs. The middle candle’s high indicates a potential resistance area.
When price action reaches these projected support or resistance zones marked by fractals, it often hesitates and tends to reverse course. Traders watch for completed fractals to identify opportune points to enter or exit positions.
Key Benefits of Fractals Indicator
There are several advantages to using fractals analysis as part of a robust trading strategy:
Pinpoints Support and Resistance
Fractals allow traders to visually identify possible support and resistance even on bare charts. This makes them highly valuable for short term and swing traders looking for optimal entry and exit levels.
Works on All Timeframes
One of the biggest benefits of fractals is that they can be applied to any chart timeframe. Daily, 4H, 1H and 15 minute charts can all be studied with fractals to gain an edge.
Universal Leading Indicator
Fractals act as a leading indicator, marking significant levels before they are tested. This allows traders to set pending orders at projected areas and anticipate reversals.
Filters Market Noise
By focusing only on significant pivot highs/lows, fractals help filter out market noise and avoid false signals. This creates high probability setups.
Can Confirm Other Indicators
Fractal analysis meshes well with other indicators like moving averages, Fibonacci retracements etc. Combining fractals with Oscillators can improve timing and precision.
Free to Use
Fractals indicator comes standard on most trading platforms like MT4 and MT5. This makes it readily accessible for all traders without any additional costs.
How Are Fractals Calculated in Forex?
Fractals are calculated using a simple five-bar pattern recognition algorithm. For bullish fractals, the formula is:
- Middle Candle: Low
- Previous Candle: Lower High
- Two Candles Before: Higher Low
- Following Candle: Higher Low
For bearish fractals, the sequence is reversed:
- Middle Candle: High
- Previous Candle: Higher Low
- Two Candles Before: Lower High
- Following Candle: Lower High
The fractal’s high or low is plotted on the actual middle candle, marking the potential turning point on the chart.
Here are the exact calculations:
Bullish Fractal
- Fractal High = High (H – 2)
- Fractal Low = Low (M)
- Where:
- H – 2 = Second candle before the middle candle (M)
- M = Middle candle in 5-bar pattern
Bearish Fractal
- Fractal High = High (M)
- Fractal Low = Low (L – 2)
- Where:
- M = Middle candle in 5-bar pattern
- L – 2 = Second candle after the middle candle (M)
These fractal highs and lows form the key support and resistance levels traders watch on all timeframes.
How to Use Fractals Indicator in Forex Trading
Now that you understand what fractals are and how they are calculated, let’s look at some practical examples of utilizing fractal analysis in forex trading:
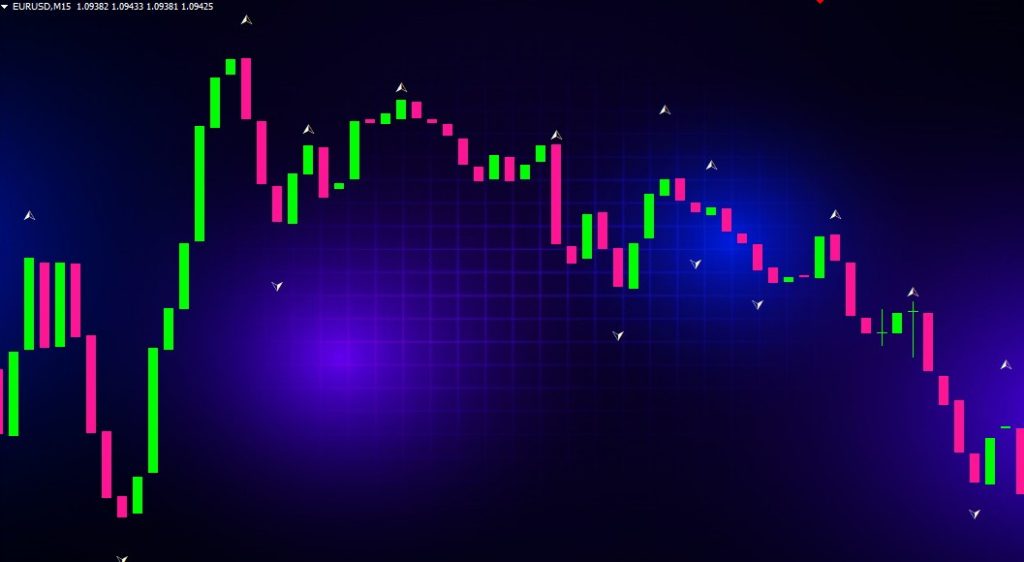
Identifying Key Levels
The first step is scanning the chart to identify any completed bullish or bearish fractals. These will start highlighting potential areas of support and resistance. Focus on fractals that align with previous swing points.
Combining with Other Indicators
Next, combine the fractal levels with indicators like moving averages (MA), Fibonacci retracements, oscillators etc. to refine analysis. Entry and exit signals are stronger with confirmation from other technicals.
Entry and Exit Points
Enter long trades at bullish fractals that align with support levels, especially after a bounce off a MA or Fib level. Place stops below recent swing lows.
Exit longs at bearish fractals near resistance zones. Close short trades at bullish fractals validating support. Open shorts at advantageous bearish fractals showing overhead resistance.
Assessing Risk vs Reward
Measure the distance between identified fractal support and resistance levels to estimate potential risk-reward ratios for higher probability trades. Larger risk-reward ratios signal an advantageous trade setup.
Trade Management with Fractals
Update stop losses to lock in profits as the price moves favorably. Move stops to break-even or recent fractal levels. Close partial positions at the next bearish fractal resistance for greater reward potential.
The Bottom Line
Using fractals indicator along with candlestick patterns, Fibonacci levels and oscillators can significantly enhance short term trading outcomes. Fractals provide high probability reversal points to capitalize on market swings.
Common Trading Strategies with Fractals Indicator
Here are some of the most effective trading tactics using the fractals indicator:
Fractals Bounce Trade
This strategy looks to buy on bullish fractals that align with support levels like a MA or Fib zone. A bearish fractal at resistance provides the exit signal.
Fractals Breakout
Traders use fractals to highlight consolidation zones and breakouts. New bullish fractals above resistance or bearish fractals below support signal momentum.
Fractals with MACD
Adding the MACD oscillator helps confirm indicator divergence at fractal levels. This creates even higher probability setups for trend traders.
Fractals with Harmonic Patterns
Combining fractal analysis with harmonic chart patterns like AB=CD or Gartley can pinpoint reversals more accurately within larger swings.
Fractals for Counter-Trend Trading
Aggressive active traders will look to fade the current momentum and enter counter-trend at key bullish or bearish fractals. This requires strict risk management.
Optimizing Fractals Indicator Settings
The standard MT4 fractals indicator comes with just one basic setting – fractal size. The default is set at 5 which looks for the standard 5-bar pattern.
Fractal Size
Increase the bars to 10 or 15 to potentially filter out more noise and focus only on larger swings. However, fewer trade signals will be generated.
Alerts
Enable pop-up, email or push alerts when new fractals form so you don’t miss any trading opportunities.
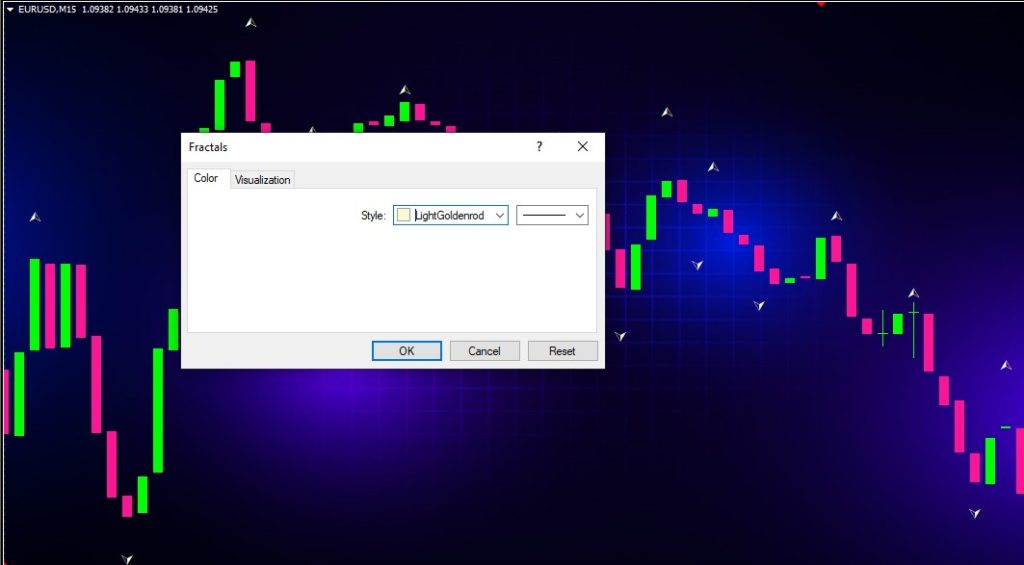
Colors
Change the default blue/red fractal colors to match your own custom chart setup for easier visual analysis.
Levels Style
Toggle the fractal points on/off or change from lines to dots based on preference. Keeping levels hidden can reduce clutter.
Modifying these simple settings can help optimize fractals indicator for your own trading style and market conditions.
Pros and Cons of Using Fractals Indicator
Let’s summarize some of the key advantages and limitations of fractals in forex trading:
Pros
- Easy to interpret
- Works across all timeframes
- Pins exact support/resistance levels
- Signals low risk/high reward trades
- Combines well with other indicators
- Available free on MT4/MT5 platforms
Cons
- Too many levels can cause clutter
- Generates frequent false signals in ranging markets
- Lags price action
- Should not be used alone
- Not ideal for breakout trading
Overall, fractals indicator remains an invaluable tool for shorter-term traders looking to define structure and enter reversals at pulled back levels. Used judiciously with other technicals, fractals can significantly boost win rates.
Common Questions About Fractal Indicators
Here are answers to some frequently asked questions about utilizing fractals analysis:
What timeframe is best for trading fractals?
Fractals can be used on any timeframe from 1 minute all the way up to monthly charts. The best time horizons are short term periods like 15min, 1H and 4H charts for most active intraday trading.
Where should I place my stop loss with fractals?
Stops are best placed 2-3 pips below the recent swing low for longs and 2-3 pips above last swing high for shorts. Trail stops to lock in profits as the trade moves in your favor.
How many confirmations do fractals need?
Individual bullish or bearish fractals provide stand-alone trade signals. However, utilizing other indicators like MACD for confirmation can boost accuracy further.
Can I use fractals in forex for scalping?
Yes, fractals are an excellent indicator for scalpers trading off smaller 1-minute or 5-minute charts during volatile sessions. Key reversals off fractal levels provide quick profits.
Do fractals repaint?
No, fractals are non-repainting since they are plotted based on past price action and do not recalculate. Levels will remain fixed once marked on the chart.
Conclusion – Fractals are a Versatile Leading Indicator
Fractals remain one of the most valuable leading indicators in the forex trader’s toolkit. They objectively identify support and resistance ahead of time, enabling traders to enter reversals early with precise risk management.
While fractals alone may generate several false signals, combining them with other technical tools creates a robust confirmation system. Fractals work flawlessly with candlestick patterns, Fibonacci, moving averages and oscillators.
Mastering fractal analysis provides a trading edge across all market conditions and timeframes. In trending markets, fractals identify pullbacks within the larger move for low risk entries. During range-bound conditions, they pinpoint support/resistance to capitalize on bounces.
If you aren’t already utilizing fractals indicator in your trading, it’s time to start. The simple fractals tool provides precision and flexibility for short-term traders looking to catch profitable swings. Add it to your chart today!