
The standard deviation is a statistical measure of volatility widely used in finance and technical analysis of the financial markets. As a technical indicator, standard deviation helps traders identify periods of high and low volatility in an asset’s price movement.
What is Standard Deviation?
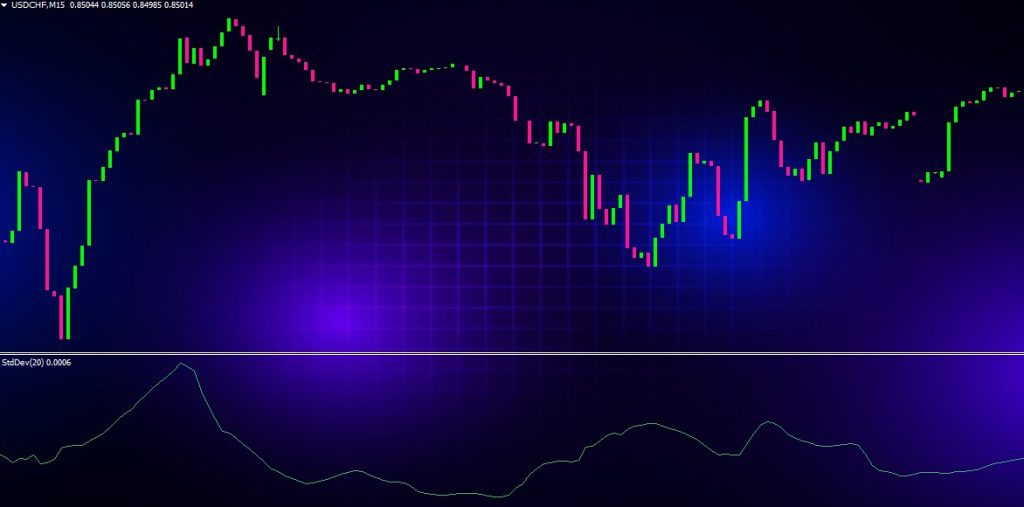
Standard deviation measures how dispersed a set of values are from their average (mean). It shows the amount of variation or dispersion within a data set.
For example, if a stock price has a standard deviation of $5, it means the stock price typically trades within $5 of the mean price. The higher the standard deviation, the wider the dispersion around the mean.
Standard deviation is calculated by taking the square root of the variance. The variance measures how far each value in the data set is from the mean.
The standard deviation formula is:
Copy code
σ = √ Σ(x – μ)2 / n
Where:
- σ = Standard deviation
- Σ = Sum of
- x = Data points
- μ = Population mean
- n = Number of data points
This gives the standard deviation for a population. For a sample, the formula uses n-1 instead of n in the denominator.
Why Use Standard Deviation in Trading?
Standard deviation acts as a guide for expected volatility. Traders mainly use it for:
Determining Volatility Levels
A higher standard deviation indicates wider price fluctuations and greater volatility. Lower standard deviation suggests tighter, more consistent pricing.
Comparing the standard deviation over different lookback periods can reveal changes in volatility trends. For example, if a stock’s 30-day standard deviation rises from $1 to $3, it signals increasing volatility.
Setting Price Targets
Standard deviation bands place upper and lower limits on expected price moves. For example, two standard deviations either side of a 20-day moving average may act as overbought and oversold levels.
Price targets can be set at integer multiples of standard deviation. A rise to two standard deviations may prompt a trader to take profits.
Assessing Risk-Return Profile
Standard deviation quantifies volatility risk. Securities with higher standard deviation carry greater risk as they experience larger price swings.
Traders may compare returns to standard deviation when evaluating if an asset’s profits sufficiently compensate for its volatility risk. Higher returns per unit of standard deviation indicate a better risk-return profile.
Identifying the Trend
A decrease in standard deviation during an uptrend indicates the trend is strengthening with smaller pullbacks. An increase shows the trend may be weakening and reversal pending.
A sideways price with declining standard deviation points to decreasing volatility during consolidation. Prices may be readying for a breakout.
Analyzing Entry and Exit Points
Traders may enter long positions when the price pulls back close to the lower standard deviation band, and exit longs near the upper band.
Conversely, short positions can be initiated near the upper band with covers and profit-taking near the lower band.
Standard Deviation Indicators for Trading
There are a few standard deviation indicators popular among traders.
Bollinger Bands
Bollinger Bands were created by John Bollinger and consist of three lines. The middle band is a simple moving average while the upper and lower bands are plotted two standard deviations above and below the middle band.
Bollinger Bands widen during volatility and contract during consolidation. Sharp price expansions above or below the bands signal overbought or oversold conditions preceding a reversal.
Keltner Channels
Keltner Channels also have central, upper and lower lines. However the central line is an exponential moving average (EMA) while the bands are plotted two average true ranges (ATR) above and below it.
Average true range measures volatility, so Keltner Channels account for changing volatility. Prices hitting the upper or lower channels suggest a reversal ahead.
Standard Deviation Channel
A more basic version plots standard deviation bands above and below a moving average. Just like Bollinger Bands, wider channels show increased volatility and tighter channels flag consolidation.
Percentage Bands
Percentage bands are similar to standard deviation bands but scale the width by a percentage of the moving average rather than standard deviation.
For example 20% bands would plot an upper and lower line 20% above and below a 10-day EMA.
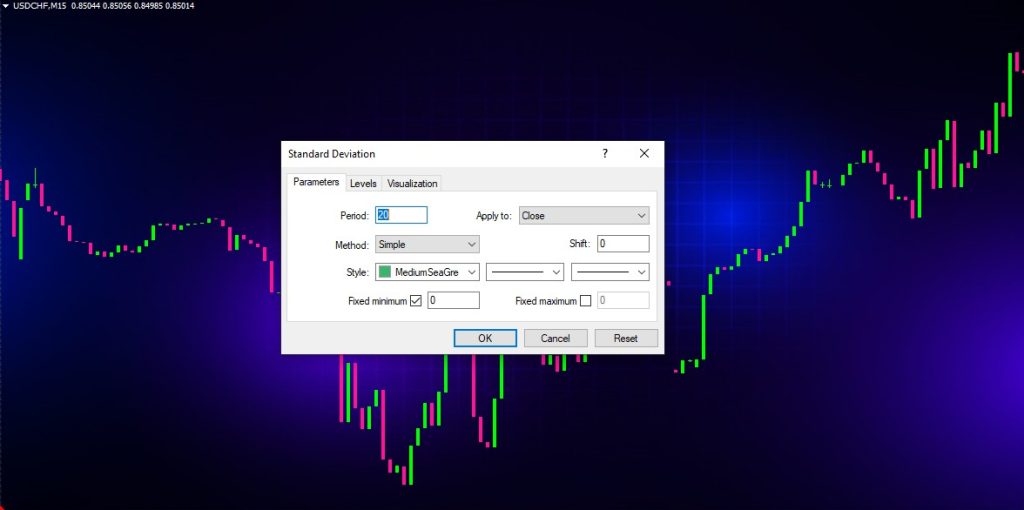
How to Add Standard Deviation in Charts
Most leading charting platforms and trading software include standard deviation indicators and bands.
To add a standard deviation overlay on a price chart:
- Select the Indicators button or tab in your charting platform
- Go to the Standard Deviation or Volatility indicator section
- Choose the type of standard deviation indicator such as Bollinger Bands
- Input the parameters including periods, moving average type, and standard deviation multiples for the bands
- Click Add on Selected Chart to overlay the standard deviation bands on your price chart
- Adjust the chart settings and time frame to analyze the indicator
Trading with Standard Deviation Bands
When trading with standard deviation, there are some key tactics to keep in mind:
- Look for price reaching the upper or lower bands to anticipate potential reversals
- Identify expanding bands signaling increased volatility and tighter bands suggesting consolidating prices
- Use pullbacks to the middle line as entry points in the overall trend direction
- Plot multiple standard deviation bands on different settings for greater signal confirmation
- Be cautious trading during periods of unusually high or low volatility
- Combine standard deviation with other indicators like RSI for higher probability setups
- Adjust your position sizing to account for wider bands and greater volatility risk
- Avoid entries when the price spikes outside the bands; wait for reversion to the mean
- Focus on the bigger trend rather than overreacting to daily price fluctuations
Pitfalls of Standard Deviation Indicators
Standard deviation technical indicators do have some drawbacks to keep in mind:
- There are lags calculating standard deviation which makes bands more suited to swing trading
- Markets can experience extended periods outside the bands during strong trends
- Bands should be adjusted for the instrument’s normal volatility level
- Signals work best when combined with other technical and fundamental signals
- Standard deviation doesn’t indicate direction, only volatility and potential reversals
- High volatility markets can cause excessive band widening generating false signals
Conclusion
Standard deviation is an invaluable statistic for measuring market volatility. Technical analysis traders rely on standard deviation bands and channels to visualize volatility, identify trend exhaustion, forecast potential turning points, and time entries and exits.
By combining standard deviation indicators with sound risk management, traders can aim to isolate high probability setups. However standard deviation should be applied in conjunction with overall technical and fundamental analysis.
Standard deviation remains a key technical indicator for quantifying volatility in charts and developing robust trading strategies. Understanding how to interpret standard deviation bands can provide a valuable edge in financial market analysis.