
The parabolic SAR (stop and reverse) is a popular technical indicator used by traders to determine trend direction and potential reversal points in the forex, stock, commodity, and cryptocurrency markets. This versatile indicator can help traders spot good entry and exit points during trends, as well as provide early warning of trend reversals.
In this comprehensive guide, we’ll cover everything you need to know about the parabolic SAR, including:
What is the Parabolic SAR Indicator?
The parabolic SAR indicator was created in the 1970s by J. Welles Wilder, who also created other popular indicators like the Average True Range (ATR) and the Relative Strength Index (RSI).
SAR stands for “stop and reverse,” which is the key to understanding how this indicator works. The parabolic SAR provides price levels that represent good stop loss points as well as potential reversals in the prevailing trend.
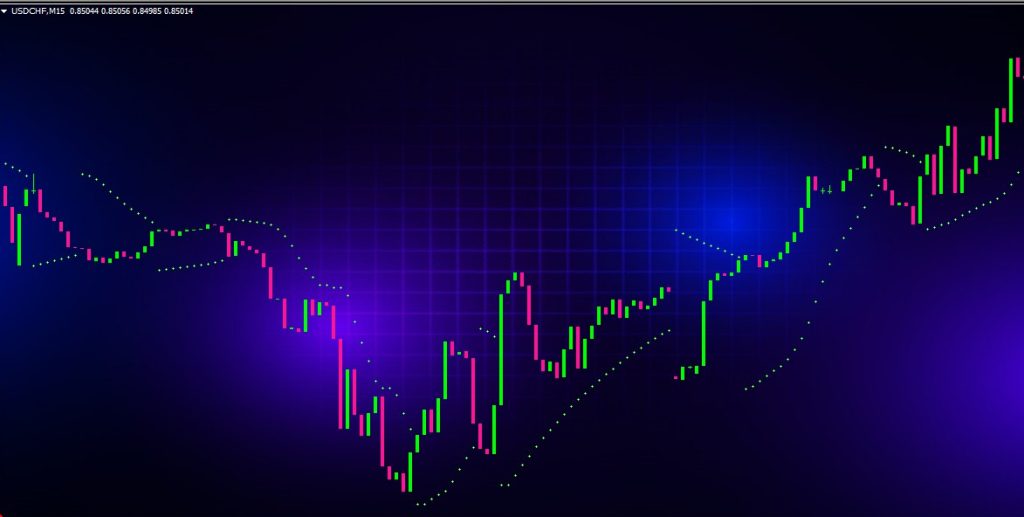
Visually, the parabolic SAR appears as a series of dots placed either above or below an asset’s price on the chart. The position of the dots indicates the direction of the trend:
- Dots below price suggest an uptrend
- Dots above price suggest a downtrend
As the trend gains momentum, the dots move further away from the price in the direction of the trend. This is the “parabolic” nature of the indicator – it accelerates away from price as the trend picks up strength.
Conversely, as a trend loses momentum and nears a potential reversal, the parabolic SAR will start moving closer towards the price. When the dot appears on the other side of the price, a reversal has occurred.
Therefore, the parabolic SAR not only indicates trend direction, but also provides trade signals and stop loss levels. Let’s explore how next.
How Does Parabolic SAR Work?
The parabolic SAR calculations use the extreme high and low prices reached during a trend to compute acceleration factors and projected future SAR levels. The formula is complex, but can be boiled down to these key characteristics:
- The SAR levels accelerate away from price in the direction of the current trend
- When a new high or low is reached, the SAR recalculates to reflect the new extremity
- As a trend weakens, the SAR decelerates and moves closer to price
- Eventually, the SAR will appear on the opposite side of price, signaling a potential trend reversal
Due to the constant recalculation, the parabolic SAR is repelled away from price during strong trends but gravitates toward price during range-bound conditions. This dynamic nature makes the indicator useful for monitoring trend strength.
Uptrend Identification
When the SAR dots flip below price, it signals the potential start of an uptrend. Traders can go long once price closes above the SAR. As price makes new highs, the SAR trails further below, showing acceleration.
During uptrends, the SAR acts as a trailing stop level. As long as price remains above the SAR, the uptrend remains intact. Closing below the SAR indicates the uptrend is over and a reversal may be underway.
Downtrend Identification
The flip of the SAR dots above price indicates a potential new downtrend. Going short after a close below the SAR could capture the emerging downtrend. The SAR then accelerates above price as new lows are reached.
In this case, the SAR serves as a trailing stop for shorts. The downtrend remains valid as long as price stays below the SAR points. A close above the SAR suggests the downtrend is ending and an upward reversal may start.
Trend Reversals
When the SAR flips from below price to above price, it signals the current uptrend has lost momentum and a downward reversal may be imminent. This creates a sell signal for traders using the SAR.
The opposite is true when the SAR flips from above to below price – it suggests a downtrend has weakened and an upward reversal could be forthcoming. The SAR flip alerts traders to a potential long signal.
In this way, the dynamic SAR dots help determine trend direction, entry signals, stop loss levels, and reversals all in one indicator. Next, we’ll walk through some visual examples.
Parabolic SAR Trading Examples
Let’s look at some real chart examples to see the parabolic SAR in action:
Uptrend Example
This EUR/USD chart shows how the SAR identified the start of an uptrend once price closed above the indicator in late August. As the uptrend gained momentum through September, the SAR trailed further below price, acting as a stop loss level.
In October, price finally closed below the SAR, signaling the uptrend was potentially over. This reversal was confirmed when the SAR then flipped above price days later, cementing the start of a new downtrend.
Downtrend Example
On this USD/JPY daily chart, we can see the SAR help confirm a downtrend. After some choppy consolidation, the SAR flipped above price in early March, putting downward pressure on the pair.
As the downtrend accelerated over the next few weeks, the SAR trailed stop losses at higher levels. When USD/JPY eventually closed above the SAR in late March, it hinted at a reversal. Indeed, the SAR then flipped below price to confirm the end of the downtrend.
Trend Reversal
This reversal example on the GBP/AUD daily chart shows the SAR quickly flipping from above to below price in late October, signaling a transition from downtrend to uptrend. The SAR then begins trailing the emerging uptrend as new highs develop.
Traders who noticed the SAR flip would have been alerted to buy the new uptrend as early as possible. The SAR provided both the reversal signal, and a logical stop loss level for the ensuing up move.
Optimizing SAR Strategy
While the basic SAR signals are helpful, traders can further optimize entries and exits by combining the indicator with other analysis techniques:
Add Momentum Indicator – Adding an oscillator like the RSI or Stochastics can help gauge momentum during SAR signals. For example, waiting for oversold readings on the RSI before buying a SAR reversal can improve timing.
Use Price Action – Look for candlestick patterns, support/resistance breaks, or chart patterns to confirm SAR signals. This gives added confidence that a genuine trend reversal is occurring.
Trail with Moving Averages – After entry, trailing a moving average can help lock in more profit during trend trades versus just relying on the SAR alone. The 20 or 50-period SMA are good options.
Use on Higher Timeframes – The SAR is prone to more whipsaws on short timeframes. Applying it to the daily or weekly charts can help filter out false signals and focus only on major trend reversals.
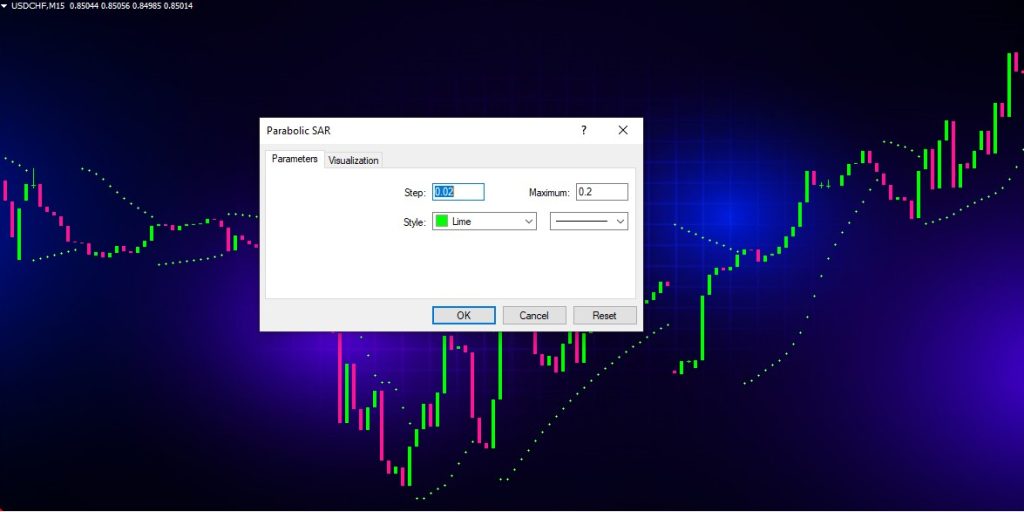
Adjust SAR Sensitivity – The SAR has an acceleration factor setting that affects its sensitivity. A higher acceleration means the SAR reacts more quickly to price changes. Default is 0.02, but values between 0.01-0.03 can be optimized.
Consider SAR Context – The SAR by itself may generate false signals. Analyzing it in the context of horizontal support/resistance, chart patterns, and other indicators can improve accuracy.
By combining these tips, traders can create a robust system using the versatile SAR indicator.
The Advantages of Parabolic SAR
There are several advantages that make the parabolic SAR a useful addition for active traders:
Identifies Trend Direction – The dynamic SAR dots immediately show whether an uptrend or downtrend is present, helping traders orient themselves in the current market environment.
Provides Entry Signals – The SAR flips alert traders to potential new trend starts as well as reversals out of old trends. This generates clear long and short trade signals.
Sets Logical Stop Losses – The SAR trailing action naturally provides stop loss levels that trail the trend. This helps lock in profits in a systematic way.
Versatile Across Markets – The SAR can be applied to forex, stocks, commodities, crypto, and most liquid markets. It adapts well to volatility and trading ranges across different assets.
Customizable Parameters – Users can tweak the acceleration factor to make the SAR more or less responsive based on their risk preferences and trading style.
Easy to Interpret – The visual dots make it simple to implement the SAR signals. No complex analysis is required beyond watching the dot position relative to price.
For traders seeking an adaptive indicator to improve trend trading, the parabolic SAR delivers helpful signals with little complexity.
Parabolic SAR Limitations
Of course, no indicator is perfect. Here are some of the limitations of the parabolic SAR:
Whipsaws During Choppy/Sideways Price Action – When the market is ranging, the SAR tends to whipsaw with price, generating false signals. Using it in trending conditions optimizes performance.
Lagging – Like all indicators based on past price, the SAR lags current price activity. There is often some delay in signaling reversals.
Stop Levels May Be Too Tight – The SAR trailing stops hug price very closely. While good for locking in profits, it also tends to get stopped out frequently.
No Signal Strength Context – The SAR only evaluates direction, not the strength of the trend. Combining with an oscillator can give more clues about upside potential.
Not Suited for Very Short Term – On smaller timeframes under the hourly charts, the SAR produces more choppy noise than tradable signals.
Despite these limitations, the SAR remains widely used thanks to its adaptability. When applied selectively during trending markets, it can be a very useful tool in the trader’s toolbox.
Putting Parabolic SAR into Action
If you want to start using the parabolic SAR in your own trading, follow these steps:
- Add the SAR to your charting platform. It comes standard on most trading platforms and charting services.
- Start applying it to daily or weekly charts to identify larger trend direction. Observe how the indicator interacts with price during trends.
- Look for SAR reversals to provide potential trade signals. Use other indicators and price action for confirmation.
- Adjust SAR parameters and apply to different timeframes and assets to see the differences. The default 0.02 acceleration factor is a good starting point.
- Use the SAR dots to trail emerging trends and provide dynamic stop losses. Trail further with moving averages for larger gains.
- Avoid choppy conditions where the SAR whipsaws back and forth across price. Focus on high momentum trends.
- Develop trading rules that define exactly how you will use the SAR signals in your overall system. Be specific with entries, stops and exits.
With some practice and fine-tuning, the parabolic SAR can provide helpful context and trade signals for momentum-based traders across many financial markets. Give this adaptive indicator a try!
Conclusion
The parabolic SAR is a versatile technical indicator that adapts to trend and volatility conditions. Its dynamic trailing dots help traders spot potential trend reversals early, while also providing logical stop loss levels.
While the SAR has some limitations around lag, whipsaws, and signal strength context, it remains a useful tool when applied selectively. Combining the SAR with price action and other technicals allows traders to build robust trend trading strategies.
Now that you understand the complete workings of the parabolic SAR, you can start experimenting with it on your own charts. Just remember to employ good risk management using stops and position sizing. The SAR can act as your “radar” to stay on the right side of trends across any market you trade.