
The market facilitation index (MFI) is a technical indicator that measures the amount of participation, enthusiasm, and volume in a market at a given time. It provides insight into whether the market is being driven by real investment activity or is experiencing low volume and dull trading conditions. MFI can alert traders to changes in market momentum before a major move occurs.
What is the Market Facilitation Index?
The market facilitation index was created in the 1990s by hedge fund manager Bill Williams. It is a volume-based indicator that uses volume flowing into a security as well as the range between the high and low of price bars to determine the level of interest and enthusiasm in a stock or asset.
The MFI analyzes volume in conjunction with range in order to categorize trading into one of three types:
High Activity and Effort (MFI > 0)
When MFI is positive, it signals a period of high volume accompanied by an increased price range between the daily high and low. This indicates strong participation by both buyers and sellers as transactions require both groups to actively engage in trades. The increased participation combined with wider daily price ranges reflects market interest and facilitation.
Low Activity but Higher Effort (MFI = 0)
A neutral MFI reading occurs when volume contracts but the price range holds steady or increases compared to recent periods. This reflects consolidation as traders pause after a recent active period. Low volume shows less participation but the wide daily range indicates traders are actively battling to set new prices. Markets frequently consolidate or trade sideways after a big move before continuing the primary trend.
Low Activity and Low Effort (-1 < MFI < 0)
When MFI is negative, it combines low volume with a narrow price range. This reflects disinterest and lackluster participation in the market. Large moves are unlikely as buyers and sellers wait on the sidelines. Negative MFI periods often lead to choppy, directionless markets.
How is the Market Facilitation Index Calculated?
The MFI calculation for any period involves three components: volume, high-low range, and a moving average of the high-low range.
To calculate the MFI:
- Measure the volume and high-low range for each period. Typically this is daily data but the indicator can use any timeframe.
- Calculate a 10-period simple moving average (SMA) of the high-low range.
- Subtract the 10-period SMA of the range from the current period’s range. High minus Low for each period.
- Divide the value from Step 3 by the 10-period SMA of the range. This normalizes the range values.
- Multiply the result from Step 4 by volume for the current period.
- Calculate the 10-period SMA of the values from Step 5. This produces the final MFI.
The steps result in higher volume and wider ranges generating greater MFI values while low volume and narrower ranges produce lower MFI. An MFI above 0 reflects facilitation while an MFI below 0 indicates dull markets.
Using Market Facilitation Index in Analysis and Trading
The MFI has many applications in technical analysis and developing trading strategies. Its ability to identify the current market type makes it a useful confirmation indicator. Ways traders can incorporate the market facilitation index include:
Confirm Trend Strength and Weakness
The MFI can act as a filter for whether a trend is gathering strength or losing momentum. In an uptrend, positive MFI reflects increasing enthusiasm which supports the trend. Declining MFI warns the uptrend may be fading even if price remains above key moving averages. The opposite applies during downtrends.
Time Market Tops and Bottoms
Extreme MFI highs above +1.5 or lows below -1.5 often occur within a few bars of market turning points. Monitor the MFI when price reaches key support or resistance levels. An extreme MFI reading suggests a reversal while a return toward zero warns that the trend may continue.
Identify Trading Range Markets
Consistently negative MFI readings below -0.5 indicate sideways, trendless trading. Use other indicators like Bollinger Bands to capitalize on rangebound levels and avoid trying to pick tops and bottoms.
Confirm Volume Analysis Techniques
Volume indicators like on-balance volume (OBV), Chaikin money flow or volume weighted moving averages should be used with price analysis. If MFI moves in the same direction as volume, it strengthens the volume signal. Divergences warn that volume may be misleading.
Spot Bull and Bear Traps
A bull trap occurs when price breaks above resistance but then quickly falls back into the trading range. This false breakout traps buyers entering too early. The MFI can signal traps by remaining negative despite the brief breakout. The opposite occurs in bear traps with the MFI staying positive through the failed breakdown.
Avoid Whipsaws in Ranging or Weak Markets
Choppy, directionless price action combined with negative MFI creates many false signals. Limit trades during dull market conditions and consider exiting choppy trades early when the MFI fails to turn positive.
Use with Other Indicators
The MFI works well confirming signals from momentum oscillators like the RSI and stochastic. Divergences between the MFI and these oscillators increase the robustness of trading signals.
Market Facilitation Index Trading Strategy
The MFI forms the basis of several trading systems to capitalize on market momentum. One strategy uses the MFI to identify Pullbacks during strong trends:
- Establish the direction of the major trend. Use the 20-period SMA and price structure.
- Identify periods where MFI moves above +1 signaling strong facilitation. Look for a cluster of consecutive positive periods.
- Wait for price to pullback toward the 20-period SMA. Use other indicators like RSI for additional confirmation.
- Enter long pullback trades when MFI turns up from near 0 while price holds above key SMA support.
- Close longs if MFI turns negative for 2 or more bars. This signals waning momentum.
The same principles apply for short trades by reversing the rules. Always trade in the direction of the prevailing trend as shown by the 20-period SMA.
Using MFI for Day Trading
The market facilitation index adapts well to short-term day trading systems across any actively traded market. Day traders focus on finding high probability price action setups that develop during strongly facilitated market environments.
Key ways to utilize MFI for intraday trading include:
Trade Pullbacks Within Existing Trends
Strongly positive MFI (above +1) that begins declining while price consolidates flags bullish continuation signals. Enter long when MFI turns back higher. The reverse applies to bearish setups.
Fade Short-Term Extremes
Oversold MFI levels below -1.5 that turn higher precede intraday trend reversals back to the upside. The opposite applies to overbought peaks above +1.5.
Avoid Late-Day Fades During Strong Moves
It is risky to counter-trend trade prior to major news events like employment reports. Sustained positive or negative intraday MFI suggests avoiding fades.
Focus on High Volume Sectors and Stocks
Analysis shows the MFI strategy works best on volatile, actively traded stocks rather than slow, thinly traded ones. Sort watchlists by average volume over the last 20 days.
Use With Other Intraday Indicators
Combine MFI with the RSI or stochastics by waiting for bullish crossovers in those oscillators when trading pullbacks within positive MFI facilitated trends.
Consider Pre-Market and After Hours Trading
The MFI adapts seamlessly to off-hours trading. Volume and volatility often persist outside regular sessions. Use 1-minute charts of extended hours with MFI for additional trading opportunities.
Optimizing Parameters for MFI Indicator
The default setting for the market facilitation index calculation is a 10-period lookback. This provides a reasonable baseline but traders can fine-tune the indicator by adjusting the parameter:
Lookback Period: The only setting is the number of bars used to calculate the averages in the formula. The standard 10-period lookback works well for daily charts. For intraday trading, experiment with faster settings like 5 or 6 periods. Slower settings between 14-20 work for weekly charts.
Signal Line: Some traders add a moving average of the MFI itself as a signal line to identify turns quicker. A 5-period SMA is a popular choice. Crossovers with MFI confirm high probability entries.
Overbought/Oversold: Consider levels above 1.5 overbought and readings under -1.5 oversold starting points. Move toward 2.0 or -2.0 for more conservative signals.
Divergences: Look for MFI diverging from price by making higher highs or lower lows. These classic reversals are strongest when confirmed by RSI or stochastic divergences.
How to Add MFI to Charts
The market facilitation index comes standard on most trading platforms. Follow these steps to add it to charts:
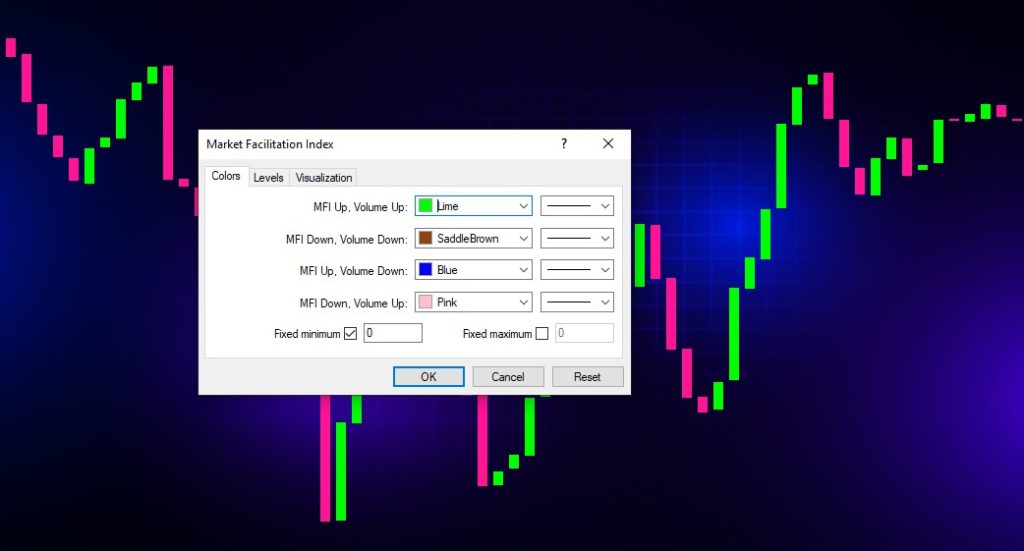
MetaTrader4
- Open the Navigator sidebar and click the Indicators folder to expand the menu.
- Scroll down and double-click on Market Facilitation Index. This adds it to the chart.
- Format the indicator by double-clicking on it or pressing Ctrl+I.
- Adjust the Parameters as desired and click OK.
TradeStation
- Select the chart where you want to add the indicator.
- Click the Indicators toolbar button to open the menu.
- Type “MFI” in the search field and select Market Facilitation Index.
- Click Add Selected to put it on the chart.
- Click the Parameters icon to format Inputs like the period.
NinjaTrader 8
- Open the Indicators tab in the Control Panel at the bottom.
- Type “Market Facilitation Index” in the search field.
- Drag the Market Facilitation Index onto the Price Chart.
- Double-click the indicator to open the Settings window.
- Adjust parameters like Period and select OK to update.
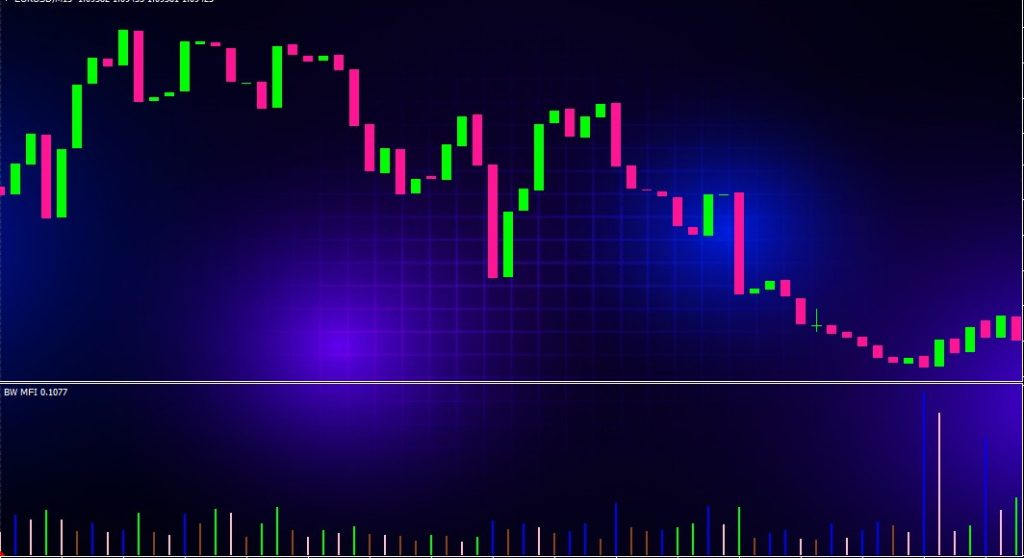
The MFI displays as an oscillator sub-graph below the price chart by default. Make sure to match the indicator’s timeframe to the actual chart timeframe.The Strengths and Weaknesses of MFI
Understanding the advantages and drawbacks of the market facilitation index allows traders to apply it effectively:
Strengths:
- Identifies current market interest and enthusiasm
- Spots divergences and extremes ahead of price reversals
- Works across markets and timeframes
- Simple calculation and interpretation
- Confirms signals from other indicators
- Filters for low probability setups
Weaknesses:
- Can remain overbought or oversold for extended periods
- Whipsaws and generates false signals during trading ranges
- Subject to repainting since it uses future data in calculations
- Requires combining with other technical indicators
- Volume data can be erratic or manipulated in some markets
- Daily range not meaningful for low volatility instruments
Common Questions About Using MFI
Here are answers to some frequently asked questions about the market facilitation index:
What timeframes work best for MFI? The indicator adapts to any chart timeframe. Use lower periodicities like 5-15 minutes for day trading, 60 minutes to 4-hours for swing trading, and daily, weekly or monthly for position trading.
Does MFI work better with stocks or forex? It works on any liquid market with reliable volume data. Stocks, futures, forex, and major cryptocurrencies all work. Avoid highly illiquid instruments.
What chart types can I use MFI on? The indicator can apply to line, candlestick, bars, point & figure and renko charts. Line and candlestick charts are most common. Point & figure signals require off-chart confirmation.
Is volume data required for the MFI? Yes, volume is a core component of the formula. The indicator only functions if historical volume data is present for the chosen market and timeframe. Tick data can substitute volume in some forex applications.
Should I trade the direction of MFI or look for reversals? Both approaches are valid. Trade pullbacks in the direction of positive MFI trends. Fade extreme negative readings below -1.5 back toward 0. Valid signals occur both with and against MFI depending on context.
Putting MFI Analysis to Work
Here are some final tips for effectively applying market facilitation index analysis:
- Use MFI to confirm entry signals and ignore setups that lack enthusiasm
- Be cautious trading against strongly negative MFI until readings move closer to 0
- Combine MFI with a momentum oscillator like the RSI or stochastic
- Focus on trading breakouts from ranging markets when MFI turns positive
- Monitor MFI divergences and extremes at support/resistance zones
- Avoid going long near upper bollinger bands if MFI is negative
- Use MFI to identify low liquidity conditions and limit position sizes
- Backtest MFI strategies and optimize indicator settings for your trading style
- Learn to integrate MFI with other volume indicators like on-balance volume
The market facilitation index provides an objective measure of enthusiasm and participation behind market moves. By confirming high probability price action setups and warning traders away from dull, low probability environments, the MFI acts as a filter designed to improve overall trading performance. Mastering interpretation of the indicator in combination with other analysis techniques can aid in better timing entries, exits, and periods of market exposure across any traded market.