
The Money Flow Index (MFI) is a technical indicator that measures the strength of money moving in and out of an asset. It aims to identify overbought and oversold conditions and potential trend reversals. This comprehensive guide will explain what the Money Flow Index is, how it works, how to calculate and interpret it, along with tips, strategies, and examples for effectively using it in forex trading.
What is the Money Flow Index?
The Money Flow Index is an oscillator indicator developed by Gene Quong and Avrum Soudack in the 1970s to measure the momentum behind money moving in and out of an asset.
It uses both price and volume data to assess whether money flow is positive or negative over a given period of time. The index ranges from 0 to 100 – a reading above 80 indicates strong positive money flow while a reading below 20 reflects weak negative money flow.
The MFI is similar to the Relative Strength Index (RSI) but incorporates volume, whereas the RSI only considers closing prices. By factoring volume, the Money Flow Index aims to provide a more accurate picture of underlying supply and demand for a forex pair.
How is the Money Flow Index Calculated?
The Money Flow Index calculation uses typical price, money flow and ratio analysis. Here are the key steps:
- Calculate Typical Price: (High + Low + Close)/3
- Calculate Money Flow: Typical Price x Volume for each period
- Sum Positive and Negative Money Flow over specified lookback period (default 14)
- Divide Positive Money Flow by Negative Money Flow to get Money Flow Ratio
- Calculate the Money Flow Index: 100 – (100/ (1 + Money Flow Ratio))
The first step is finding the typical price for each period, which uses the average of the high, low and closing prices.
Next, multiply the typical price by the volume to get the money flow. The money flow will be positive when the typical price rises and negative when it falls.
These positive and negative money flows are then summed over a specified lookback period, usually 14 periods. The most common settings are 14, 21 or 28 periods.
The money flow ratio is calculated by dividing the positive sum by the negative sum. Finally, this ratio is plugged into the MFI formula above to convert it into an indexed scale from 0 to 100.
How to Use and Interpret the Money Flow Index
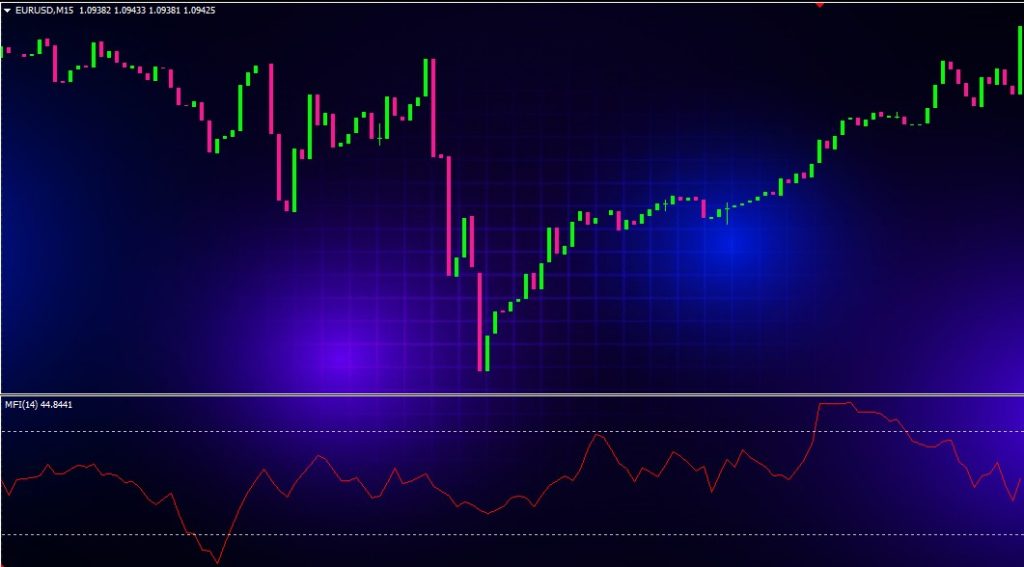
The Money Flow Index is primarily used to identify overbought and oversold conditions in the forex market. It can also spot divergences and changing momentum that may foreshadow potential trend reversals.
Here are key levels and signals to watch for when analyzing the MFI:
- Readings Above 80 = Overbought: The asset is seeing strong buying pressure, so look for potential reversal signals.
- Readings Below 20 = Oversold: The asset is seeing solid selling momentum, so be alert to reversal signals.
- Between 20-80 = Normal Range: Money flow is balanced and the trend is likely to continue.
- Above 50 = Positive Money Flow: Buyers have more control. Below 50 shows stronger selling pressure.
- Divergence: This occurs when price diverges from the MFI. For example, price reaching new highs while MFI is declining could signal waning momentum and potential trend weakness or reversal.
Tips and Strategies for Trading with the Money Flow Index
Here are some tips for effectively using the Money Flow Index in your forex trading:
- Use it alongside price analysis to confirm strength or weakness. The MFI on its own is not a buy or sell signal.
- For best results, use it on hourly, 4-hour or daily charts. The longer the lookback period, the more reliable the signals.
- Identify overbought or oversold readings, then watch for reversal patterns like double tops, head and shoulders or wedge patterns to emerge.
- Trade pullbacks from extreme highs or lows. For example, when MFI pulls back from overbought territory, consider short positions.
- Look for divergence between MFI and price direction as a possible momentum shift. This could foreshadow a trend change.
- Use it to determine entry and exit points. Initiate trades when MFI moves back into its normal range from extreme levels.
- Combine MFI with other indicators like Bollinger Bands or MACD for better accuracy. Dual confirmation reduces likelihood of false signals.
Real World Examples of How to Trade with the Money Flow Index
Let’s look at some real trading scenarios to see how the Money Flow Index can be used to complement price action analysis and identify high-probability setups.
Overbought Divergence for Potential Reversal
In this EUR/USD 4-hour chart, the price put in a new high while the MFI formed lower highs, reflecting waning upside momentum. This bearish divergence at overbought levels signaled growing downside pressure.
The MFI dipping back below 80 and the bearish engulfing pattern confirmed the reversal. This presented a high probability shorting opportunity, with potential downside targets at the previous swing low and support zone.
Oversold Bounce
Here we see the MFI on the daily USD/CAD chart falling into oversold territory below 20 while the price dropped to a key support level.
The bullish divergence combined with the oversold bounce back above 20 signaled solid upside momentum. This presented a high probability long entry, with upside targets at the resistance level and previous swing high.
Extended Overbought for Continuation
This daily NZD/USD chart shows the MFI remaining elevated above 80 in overbought territory as the uptrend extends. The MFI overbought conditions reflect strong upside momentum despite the extended move.
With the price breaking out above the range highs, this MFI signal gave the green light for joining the uptrend. The next resistance levels based on previous highs and the 127.2% Fibonacci extension provide profit targets.
Pitfalls to Avoid When Using the Money Flow Index
While the Money Flow Index is a useful indicator, there are some pitfalls to avoid when using it:
- Don’t Use it as a Standalone Tool – Cross-reference MFI signals with other technical analysis like price action, candlestick patterns and trend indicators. Dual confirmation gives you an edge.
- Watch Out for False Divergence – Sometimes a divergence doesn’t result in a reversal, so have contingencies ready. Wait for confirmation from a price pattern or other indicator.
- Use Longer Time Frames – The MFI tends to be more reliable on the daily or weekly charts. Use lower timeframes only for entry and exit timing.
- Adjust Settings to the Market – Consider using longer lookback periods (50, 100 or 200) for less volatile currency pairs and shorter settings (5, 10) for volatile pairs.
- Beware the Sideways Market – Low volatility and weak trends can cause more whipsaws. Use tighter stops or avoid trading during rangebound conditions.
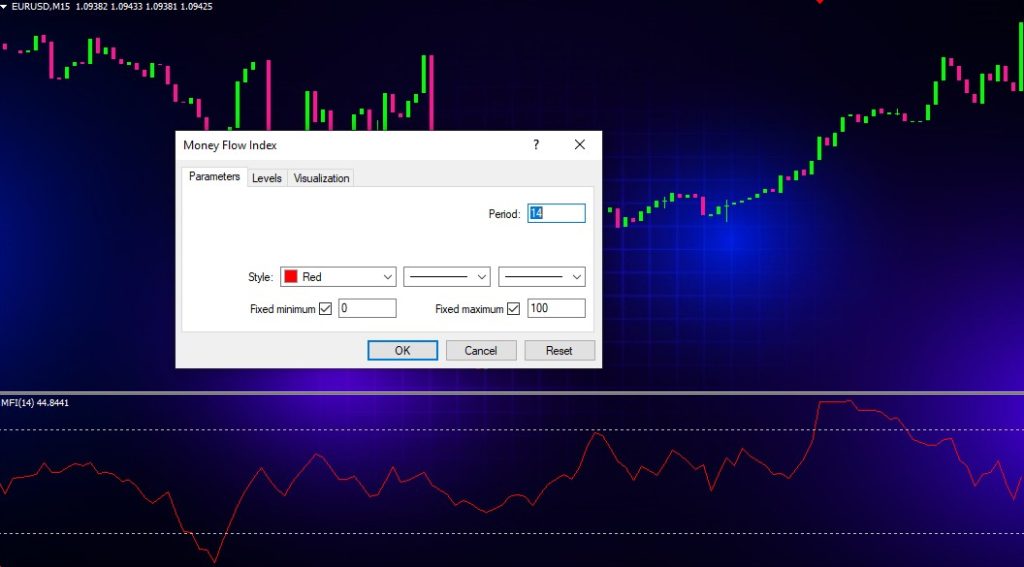
Choosing the Right MFI Lookback Period and Settings
The standard Money Flow Index setting is 14 periods. However, you can adjust this lookback period as well as the overbought and oversold levels based on the market conditions and your trading style. Here are some guidelines:
- For swing trading, use longer timeframes like 50 or 100. For day trading, shorter periods like 5 or 10 may suit better.
- In strong trends, raise overbought to 85+ and oversold to 15- to avoid premature exits. In ranging markets, reduce to 60/40 to catch reversals faster.
- For less volatile pairs like EUR/USD, use longer settings like 20 or 21. For volatile pairs like GBP/JPY, shorter settings around 10 work better.
- Backtest to analyze which MFI settings match best with the typical volatility and trends in the currency pairs you trade. Optimize based on historical performance.
- Consider combining MFI with an envelope indicator or band to identify extremes. For example, plot MFI with Bollinger Bands or Keltner Channels to spot overextensions.
Money Flow Index Trading Strategy Examples
There are many potential trading strategies using the Money Flow Index. Here are a few popular methods:
MFI Pullback
- Identify currency pair in a strong uptrend or downtrend
- Wait for minor pullback towards midline of 50
- Enter new long/short position in direction of trend when MFI rebounds off midline
- Place stop below recent swing low for longs or above swing high for shorts
- Ride the pullback for continued trend direction
MFI Divergence
- Find divergence between price and MFI – for example, price reaches new high but MFI forms lower high
- Identify bullish or bearish price reversal candlestick pattern during divergence
- Enter short trade on bearish pattern when MFI breaks back below overbought level 80
- Enter long trade on bullish pattern when MFI breaks back above oversold level 20
- Use pattern projected target for take profit
MFI Overbought/Oversold Bounce
- Look for MFI to reach overbought above 80 or oversold below 20
- Watch for MFI to turn back up from oversold or turn back down from overbought
- Enter long when MFI breaks above 20 or enter short when MFI breaks below 80
- Place initial stop on other side of 80/20 threshold
- Ride reversal to middle Bollinger Band or Keltner Channel for exit
Pros and Cons of Trading with the Money Flow Index
Pros:
- Identifies overbought/oversold levels and gauges strength of trend
- Incorporates volume for better accuracy than RSI
- Helps confirm price action trading strategies
- Can spot subtle momentum changes with divergence
- Oscillator formula adjusts to market volatility
- Easy to interpret single line bounded by 80/20
Cons:
- Subject to false signals and whipsaws
- Divergence doesn’t always lead to reversal
- Prone to repainting since based on changing price/volume
- Not ideal for low liquidity or high volatility instruments
- Difficult to combine with other indicators
- Limited customization options
Common Questions About the Money Flow Index
Here are some frequently asked questions about the Money Flow Index:
What does MFI measure?
MFI measures the inflow and outflow of money into an asset to gauge buying and selling pressure. It incorporates volume and price data.
How is MFI different than RSI?
The main difference is MFI factors in volume while RSI only looks at closing price. This makes MFI more responsive to changes in asset demand.
What timeframes does MFI work best with?
MFI is most effective on daily, 4-hour and 1-hour timeframes. For shorter timeframes, RSI is often a better choice.
What instruments can MFI be used for?
MFI works well with all liquid forex pairs and major stock indexes. It may be less effective for low volume or highly volatile assets.
Does MFI have any limitations?
Like all indicators, MFI is prone to false signals. Divergence doesn’t always result in a reversal. Also, it lags price similar to other momentum oscillators.
Conclusion
The Money Flow Index is a versatile indicator that provides helpful insight into forex trends, momentum, volatility and trade entry/exit points. By identifying overbought and oversold conditions, it helps gauge potential support and resistance levels as well as trend strength.
However, MFI should not be used as a standalone indicator. For best results, combine it with price action analysis and other technical indicators on higher timeframes to take advantage of high probability trade setups. MFI works best when properly customized for the instrument and trading style.
By mastering the intricacies of the Money Flow Index, traders can better time entries during trend pullbacks or reversals. The MFI is one of the most valuable tools available for assessing the all-important money flow behind market movements.