

The Awesome Oscillator is a momentum indicator used frequently by forex traders to analyze market trends. This oscillating indicator was created in the 1990s by famous trader Bill Williams, and remains an extremely popular tool today. In this comprehensive guide, we’ll explain everything you need to know about the Awesome Oscillator—how it’s calculated, how to interpret signals, how to incorporate it into your trading strategy, and more.
What is the Awesome Oscillator?
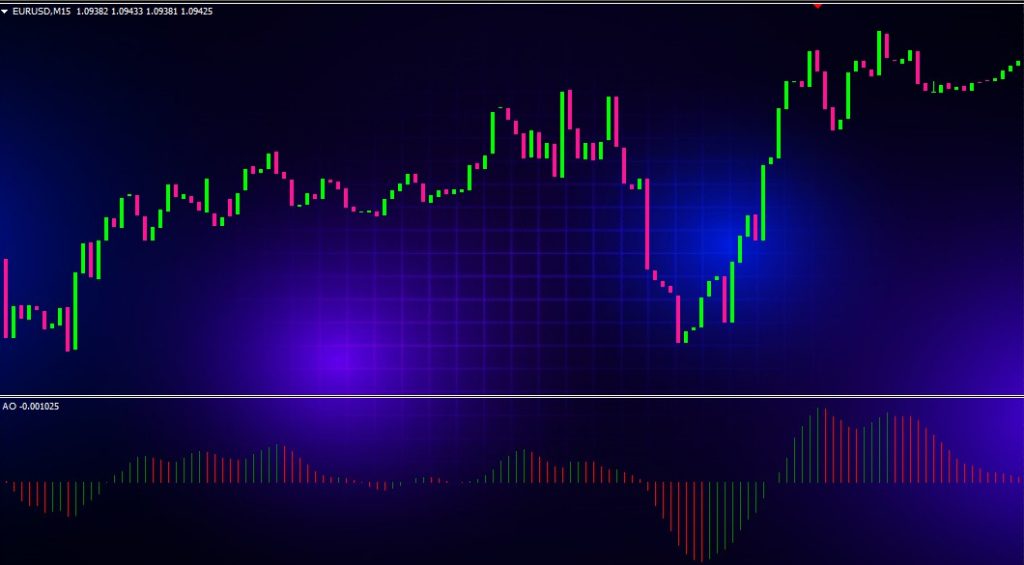
The Awesome Oscillator (AO) is a 34-period simple moving average, plotted through the central points of the bars of a histogram built with the bar’s midpoints. It is used to confirm trends and anticipate upcoming reversals by analyzing the momentum behind price movements.
The AO calculates market momentum by analyzing the difference between a 34-period and 5-period simple moving average. The longer 34-period SMA provides the “slow” perspective, while the shorter 5-period SMA offers the “fast” perspective. Subtracting the 5-period SMA from the 34-period SMA plots oscillation above and below zero to reflect whether shorter-term momentum leads or lags longer-term momentum.
The Formula
AO = SMA(Median Price, 5 periods) – SMA(Median Price, 34 periods)
Where:
- SMA = Simple moving average
- Median Price = (High + Low)/2
So in short, the AO measures the difference between a 34-period and 5-period SMA calculated based on the median price of each bar.
The default setting is a 34-period SMA versus a 5-period SMA. However, traders can adjust these periods based on the timeframe they are analyzing or their personal preference. Typically, the longer SMA window falls between 25-50 periods, while the shorter SMA ranges from 2-10 periods.
How to Interpret the Awesome Oscillator
The Awesome Oscillator is displayed as a histogram oscillating above and below zero. When the shorter-term SMA is greater than the longer term SMA, momentum is increasing and the AO histogram will rise. When the longer SMA is greater, momentum is decreasing and the AO histogram falls.
Above Zero = Bullish Momentum
When the AO histogram is above zero, it signals increasing bullish momentum. The 5-period SMA is above the 34-period SMA, so shorter-term momentum is outpacing longer-term momentum.
Below Zero = Bearish Momentum
When the AO histogram is below zero, it signals increasing bearish momentum. The 34-period SMA is above the 5-period SMA, so longer-term momentum is greater than short-term momentum.
Crossing Zero
Crossing above zero indicates upside momentum is accelerating, while crossing below zero signals downside momentum is accelerating. Moving from positive to negative momentum could foreshadow a trend reversal.
AO Signals
Here are the main Awesome Oscillator trading signals to watch for:
- Saucer: An AO saucer consists of two consecutive peaks above zero, with a trough below zero in the middle. This signals bullish momentum is potentially reversing into a downward trend.
- Dome: A dome consists of two consecutive troughs below zero, with a peak above zero in the middle. This signals bearish momentum is potentially reversing into an upward trend.
- Zero Crossovers: Bullish when AO crosses above zero, bearish when crossing below. Shows potential acceleration in that direction’s momentum.
- Peaks and Troughs: Bullish when peaks rise while troughs begin to flatten out. Bearish when troughs drop lower while peaks begin to flatten. Indicates momentum strength.
- Sharp Spikes Up or Down: Shows strong momentum in that direction, especially on higher time frames. Watch for potential reversals.
Let’s break down each of these signals in more detail:
The Saucer
A saucer consists of two peaks above zero, with a trough below zero in between. This shows bullish momentum is rising in waves with some bearishness pulling back in the middle. But importantly, the main bullish momentum peaks are not making new highs.
This loss of upside momentum indicates a potential trend reversal, so traders watch for a drop through support. The AO saucer is a classically bearish reversal signal, foreshadowing that an uptrend may soon exhaust itself.
The Dome
A dome consists of two troughs below zero, with a peak above zero in between. This shows bearish momentum is dropping in waves, with some bullishness bouncingback in the middle. But importantly, the main bearish momentum troughs are not making new lows.
This loss of downside momentum indicates a potential trend reversal, so traders watch for a break above resistance. The AO dome is a classically bullish reversal pattern, signaling that a downtrend may be nearing its end.
Zero Crossovers
Bullish zero crossovers occur when the AO histogram crosses up above zero, showing bullish momentum is accelerating over bearish momentum. This confirms an uptrend and suggests long trades.
Bearish zero crossovers occur when the AO crosses below zero, showing bearish momentum exceeding bullish momentum. This confirms a downtrend and prompts exiting longs or considering shorts.
Peaks and Troughs
Rising peaks show bullish momentum is strengthening. If accompanied by flattening troughs, it signals upside momentum is taking over. This pattern suggests an uptrend is solidifying.
Falling troughs indicate bearish momentum is strengthening. With flattening peaks, it signals downside momentum is dominating. This pattern implies a downtrend is gaining steam.
Spikes Up and Down
Large spikes above zero reflect surging bullish momentum, while big spikes below zero signal strong bearish momentum. These sharp moves show forceful directional momentum, especially on higher time frames.
However, strong spikes frequently precede reversals. After a large bullish spike, watch for bearish signals like a saucer. After large bearish spikes, be alert for bullish signals like a dome.
Trading with the Awesome Oscillator
The Awesome Oscillator is a versatile trading indicator that can be incorporated into most forex strategies. Here are some ways traders commonly utilize the AO:
Confirming Trend Direction
The AO is an excellent tool for visually confirming the strength and direction of trends. When the AO is oscillating above zero, it validates that bullish momentum is in command. Trading with the trend improves odds of success.
Below zero shows bearish momentum is dominating. Again, trading with the momentum direction gives you an edge. If the AO doesn’t confirm the trend bias you expect, proceed with caution.
Identifying Reversals
The AO excels at signaling upcoming reversals through formations like saucers and domes. It can also forecast reversals when momentum appears exhausted after a long trending move.
For example, if the AO shows bearish momentum slowing through flattening troughs, begin watching for a move back above zero. This warns that upside momentum is regaining strength and a reversal could soon occur.
Combining with Other Indicators
For even higher odds trades, add AO analysis to your current strategy. For example, combine AO signals with classic reversal indicators like double tops/bottoms, head and shoulders patterns, wedge and triangle breakouts, and more.
Overlaying the AO with moving average crosses or other oscillators like MACD can also boost accuracy. Multiple confirming signals give you greater confidence in trend direction.
Entry and Exit Signal
Some traders use AO crossovers to trigger entries and exits directly. For example:
Enter Long: AO crosses above zero
Exit Long: AO crosses below zero
Enter Short: AO crosses below zero
Exit Short: AO crosses above zero
While this approach can be profitable, also incorporate price action context like support/resistance levels, chart patterns, and volume.
Divergences
The AO frequently forms bullish and bearish divergences relative to price. Divergences occur when the AO and price move in opposite directions.
For example, price makes a new high while the AO forms lower highs. This bearish divergence suggests upside momentum is faltering, warning a reversal could soon occur.
Optimizing the Awesome Oscillator
The AO default settings are a 34 and 5-period SMA, but you can fine-tune these values for your timeframe or strategy:
Shorter Trend Trading
For shorter-term trend trading off 5-15 minute charts, shorten the SMA windows. For example, try a 10/5 combination, bringing signals closer to real-time price action.
Longer Trend Trading
For longer-term swing trading off 4-hour or daily charts, lengthen the SMA windows. For example, try a 50/15 or even 75/25 combination to focus on wider momentum.
Faster Oscillation
To speed up AO oscillation, widen the gap between the fast and slow SMAs. For example, 50/5 will oscillate faster than 34/5.
Slower Oscillation
To slow down oscillation, bring the two SMAs closer together. For example, 25/15 will oscillate slower than 34/5.
Volume
Add a volume oscillator to confirm signals with expanding volume. High volume AO signals have a stronger probability of follow-through.
Experiment to find the settings that best match your trading style and timeframes. The standard 34/5 values work well for many strategies, but optimization can improve performance.
Awesome Oscillator Pros and Cons
Let’s summarize the key advantages and limitations of this indicator:
Pros
- Momentum oscillating clearly above/below zero
- Easy visual signals like saucers, domes and spikes
- Confirm trend direction
- Spot momentum divergences
- Generate trade entry/exit signals
- Versatile for multiple strategies and timeframes
Cons
- Too many false signals whipsawing in ranging markets
- Lagging – not useful for very short-term trading
- Signals require price confirmation
- Divergences don’t guarantee imminent reversals
- Prone to repainting
While the Awesome Oscillator has some drawbacks to be aware of, it remains an extremely useful indicator for most forex traders when applied properly.
Awesome Oscillator Trading Strategy
Now let’s take a look at a simple but effective trading strategy incorporating the AO.
This system uses the AO to confirm trend direction, anticipate reversals early, and time entries. Stop losses and profit targets are based on recent swing points.
Trading Rules
- Use AO on 30 min, 1 hour, or 4 hour timeframe
- Only trade with trend confirmed by AO above/below zero
- Buy when AO crosses above zero OR forms bullish saucer/dome
- Sell when AO crosses below zero OR forms bearish saucer/dome
- Place stop loss below recent swing low on longs
- Place stop loss above recent swing high on shorts
- Target minimum 1:2 risk/reward
- Manage winners to ride as long as momentum persists
This straightforward approach allows the AO’s intuitive signals to guide high-probability trend trades. Traders can implement it across forex, commodities, indices and stocks.
Conclusion
The Awesome Oscillator stands out through its ease of interpretation and versatility. While any indicator has pros and cons, the AO’s strengths make it a worthwhile addition for most forex trading strategies.
Use the AO to assess momentum direction, confirm trade bias, time entries, spot divergences, and forecast potential reversals early. Fine-tune the settings based on your style and timeframes. Look for enhanced accuracy by combining signals with other indicators.
Mastering the AO requires practice analyzing charts from multiple markets and time perspectives. But with a bit of experience, it can provide an “awesome” boost to your overall edge and trading results.