
The average true range (ATR) is a technical analysis indicator used in the foreign exchange (forex) market to measure market volatility. The ATR gives forex traders valuable insights into the levels of risk and potential profit for a chosen currency pair over a selected timeframe.
In this comprehensive guide, we will explore what the average true range indicator is, how it is calculated, and how forex traders can apply the ATR in their trading strategies.
What Is the Average True Range (ATR)?
The average true range is a technical analysis indicator that measures market volatility by analyzing the range between high and low prices over a given period. The true range is the greatest of the following:
- Current high less the current low
- Current high less the previous close (absolute value)
- Current low less the previous close (absolute value)
The ATR calculates the average of the true ranges over a selected lookback period. Standard lookback periods are 14, 20 or 30 bars. A higher ATR reading indicates higher volatility, while a lower reading shows more rangebound, non-trending behavior.
In forex trading, the ATR indicator acts as a measure of volatility and helps determine appropriate trade position sizing. Traders mainly use the ATR to set stop losses and manage risk. It can also generate trade signals in some strategies.
How to Calculate the Average True Range

The ATR calculation uses the true range and a simple moving average (SMA). Here are the steps:
Calculate the true range for each period:
- True Range = Max[(Current High – Current Low), Abs(Current High – Previous Close), Abs(Current Low – Previous Close)]
Sum the true ranges over the lookback period (typically 14 bars)
Divide the sum by the number of periods to get the ATR
On the first day of the initial lookback period, the ATR is simply the true range. On the second day, it is the average of the first two true ranges. After the initial lookback period, the ATR line continues calculating as the average of the prior periods.
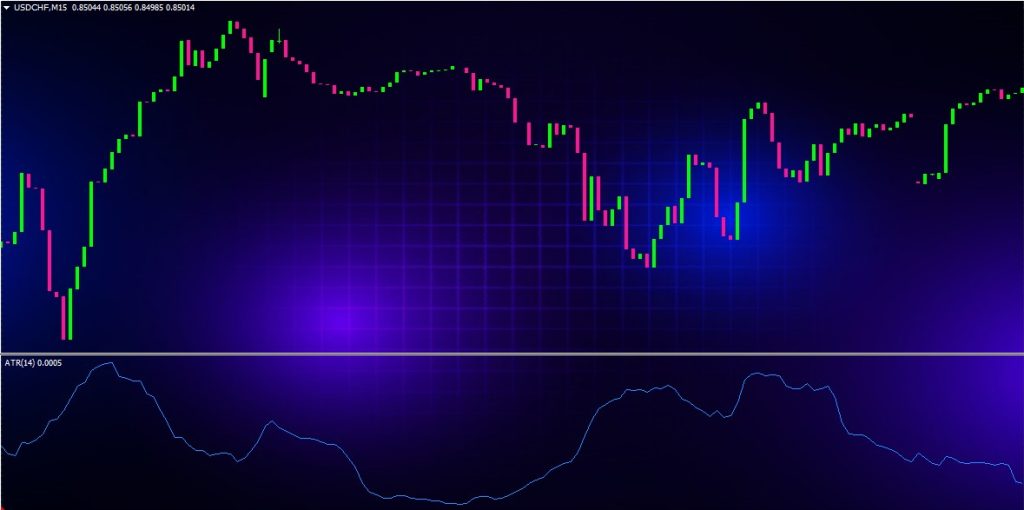
The ATR is displayed as an oscillating line, centered on a zero line. A higher ATR reading signals increased volatility.
How Traders Use the Average True Range
The main uses of the average true range indicator in forex trading include:
Measuring Volatility for Risk Management
The most common application of the ATR is to gauge volatility and determine stop losses. Higher ATR readings signal wider stop losses are needed to account for increased volatility. Lower ATR readings allow tighter stops. This adjusts stops based on market conditions.
For example, if the ATR on the EUR/USD daily chart is 60 pips, the trader may decide to place stops 100 pips away from entry to account for volatility. If the ATR drops to 30 pips, stops can be tightened to 50 pips.
Position Sizing Based on Volatility
By assessing volatility with the ATR, traders can determine appropriate position sizes. When volatility rises, smaller position sizes are warranted to limit risk. When volatility drops, larger sizes may be acceptable.
For example, if the ATR reading doubles, a trader may halve their position size accordingly. This applies fixed fractional position sizing based on the ATR.
Setting Price Targets
The ATR can help establish realistic price targets for long or short trades. Multiples of the ATR reading can be used to project potential profit targets.
For example, if buying near 1.1200 on the EUR/USD with an ATR of 30 pips, potential targets could be 1.1230 (1 x ATR), 1.1260 (2 x ATR) and 1.1290 (3 x ATR).
Trading Signals in Range and Breakout Strategies
In some trading systems, the ATR itself acts as a signal line. For range-bound strategies, low ATR readings can signal conditions where the price is apt to stay within a narrow range. High readings show breakout potential.
The ATR line can also generate crossover signals on other indicators like moving averages. For example, the ATR crossing below a longer-term moving average could signal low volatility ahead.
Assessing Trend Strength
Comparing the ATR to the prevailing price trend can provide clues on trend strength. If the ATR is moving higher while the price trend is rising, it signals strong momentum. If the ATR diverges lower as price continues higher, it indicates a weaker uptrend.
Smoothing Other Indicators
Since the ATR is a smoother moving average component, some traders use it to create more lag in other indicators like the Relative Strength Index (RSI) or Moving Average Convergence Divergence (MACD). This technique can filter out false signals.
Average True Range vs. Other Volatility Indicators
The ATR has some similarities and differences compared to other popular volatility indicators:
- Bollinger Bands – The upper and lower Bollinger bands also expand and contract based on volatility. However, Bollinger bands do not quantify volatility in pips like the ATR.
- Keltner Channels – Uses the ATR in its calculation. The upper and lower channels contain prices similarly to Bollinger bands.
- Donchian Channels – Donchian channels plot the highest high and lowest low over a lookback period, creating volatility-based channels. The ATR quantifies volatility in pips rather than using price levels.
Overall, the average true range is the simplest volatility indicator for directly measuring volatility in pips. It avoids complex formulas and works well for risk management.
Average True Range vs. Average Daily Range
The average true range differs from the average daily range (ADR), another popular indicator.
The ADR simply calculates the average daily trading range over a period, typically 14 days. It does not account for gaps between close and open prices across multiple days.
The ATR uses the true range calculation to account for gaps, giving a more accurate assessment of volatility than the simpler ADR. Most forex traders favor the ATR over ADR for analyzing volatility.
Average True Range Trading Strategies
ATR-based trading strategies center around using volatility for risk management, but can also incorporate ATR signals. Here are some approaches:
ATR Stop Loss Strategy
This straightforward strategy uses ATR multiples to set dynamic stops on all trades. For example, stops could be set at 2x or 3x the current ATR reading below entry for longs, and above entry for shorts. As the ATR rises or falls, stops adjust accordingly.
ATR Range Trading
For range trading strategies, the ATR can help define the expected trading range. Entries near support can be taken with ATR-based stops. Targets to close profits can be placed near resistance levels.
ATR and Moving Averages
Crossovers between the ATR and longer-term moving averages can generate signals. For example, long trades when the 20-period ATR crosses above the 50-period SMA. Shorts are taken on the reverse crossover.
ATR Price Channel Breakouts
Donchian channels or basic ATR multiples (1x, 2x, etc) above and below price can create volatility-adjusted channels. The ATR can signal breakouts when price closes outside the ATR channel.
ATR to Measure Trend Strength
Monitoring ATR direction compared to the price trend reveals information on momentum. Rising ATR with an uptrend signals strong momentum. Declining ATR and higher prices shows fading strength.
The ATR forms the foundation of multiple trading strategies by providing an always up-to-date gauge of volatility. Combining ATR analysis with price action or other indicators can yield robust trading signals.
Tips and Notes for Trading with Average True Range
When adding the ATR to your forex trading, keep these tips in mind:
- Adjust the ATR periods to suit your strategy. 14 is standard but longer periods like 20 or 30 produce a smoother ATR for trends.
- Increase ATR multiples for wider stops and tighter profit targets during high-volatility events like news releases.
- Monitor ATR on multiple timeframes. Larger timeframes show overall volatility, shorter periods for near-term conditions.
- Combine ATR with Japanese candlestick patterns to avoid trading false breakouts during low-volatility ranges.
- Consider ATR-based trailing stops that trail behind price by 1x or 1.5x the ATR, vs. fixed pip stops.
- Avoid ATR signals during the Asian trading session, when volatility tends to be lower. Use London or New York sessions.
- Be aware that rapid ATR spikes are common during news events. Wait for ATR to stabilize before adjusting stops or position sizes.
Mastering the average true range indicator takes experience, but the ATR can become a core component of your trading plan. Keep volatility at the forefront of your risk management approach.
Average True Range Indicator Settings
The ATR has two main settings – the lookback period and method for calculating averages:
ATR Period – The standard setting is 14 bars, which offers a balanced perspective for short-term trading. Longer periods like 20 or 30 bars produce a slower ATR more suited to longer-term trends. Shorter periods like 7 bars provide a more responsive ATR for very short-term strategies.
Method – The default is exponential moving average (EMA). Some traders opt for the smoothness of a simple moving average (SMA) instead. Wilder originally used SMA for the ATR before EMAs were commonplace. Test to see if SMA or EMA fits your strategy best.
Keep settings consistent when analyzing or trading the ATR. Adjustments to the ATR period can be made based on faster or slower market conditions as needed.
Average True Range Indicator Limitations
While useful for forex traders, the ATR does have some limitations:
- Lagging indicator – The ATR is a lagging indicator since it relies on previous periods. The current ATR may not reflect the most recent volatility.
- Does not predict direction – The ATR gauges volatility but provides no clues on price direction. Additional indicators are needed for assessing trend direction.
- Spikes on gaps/news – The ATR can spike higher or lower on price gaps, limiting its use right after major news events.
- No fixed levels – The ATR reads in pips but does not provide defined price levels. Traders must apply the ATR as a signal rather than trading fixed ATR levels.
- False signals – Just like other indicators, the ATR may generate false crossover or breakout trade signals that trigger losing trades.
The ATR is best used in conjunction with other analysis like price action context, overall trends, or additional indicator confirmation. It should not be used on its own for trade signals.
Average True Range FAQs
Some frequently asked questions about the average true range include:
What is a good ATR reading for day trading forex?
For intraday trading the ATR should be relatively low, generally between 20-50 pips. High intraday ATR above 60-80 pips makes day trading difficult.
How do you trade when ATR is high?
When volatility is high based on the ATR, tighten stops and reduce position size. Focus on trading in the direction of the major trend only, avoiding range trades.
What does a big spike in ATR mean?
A major ATR spike indicates a surge in volatility, typically due to a news event or other fundamental driver. Avoid new trades until the ATR starts descending back to normal levels.
Is ATR more important than price action?
Price action context is still the most important factor. Use the ATR as a volatility gauge, but base trades on price behavior and structure.
What ATR level is high or low?
The ATR level meaning high or low volatility is relative. It depends on the particular forex pair’s typical ATR range and your strategy time horizon. ATR under 30 pips is generally considered low on the major pairs for swing trades.
Conclusion
The average true range is one of the most useful indicators in forex trading for measuring and accounting for volatility. The ATR transforms volatility into a simple numerical value quantifying risk.
Use the ATR to size positions properly, set logical stops, project targets, and time entries during periods of quieter market conditions.
By using the average true range indicator to frame risk, forex traders can implement more effective money management and ultimately improve their overall performance. Monitoring volatility through ATR analysis should form a key part of your market analysis.