
The Average Directional Movement Index (ADX) is a popular technical indicator used by forex traders to determine the strength of a trend. The ADX does not indicate trend direction or momentum, but rather the presence or absence of a trend. By understanding how to use the ADX indicator properly, traders can gain valuable insight into market trends to inform their trading decisions.
What is ADX?
The Average Directional Movement Index was created in 1978 by J. Welles Wilder and introduced in his book New Concepts in Technical Trading Systems. The ADX is based on the Directional Movement System, which also includes the Positive Directional Indicator (+DI) and Negative Directional Indicator (-DI).
The ADX measures the strength of a trend but not the direction. It ranges from 0 to 100, with readings below 20 indicating a weak trend or ranging period and readings above 40 signaling a strong trend. The higher the ADX value, the stronger the trend.
How is ADX Calculated?
The ADX involves complex mathematical formulas, but in simple terms it works by measuring the difference between the +DI and -DI. These two indicators track uptrends and downtrends respectively using the highs and lows of price bars over a given period.
The +DI measures how strong the uptrend is: if the +DI is rising, it means the uptrend is strengthening. The -DI does the same for downtrends.
The ADX takes the spread between the +DI and -DI, averages it, and smooths it into a single trend strength indicator. The wider the spread between +DI and -DI, the stronger the trend.
More specifically, the steps to calculate ADX are:
- Calculate the +DI and -DI based on price highs and lows over a set timeframe (typically 14 bars)
- Calculate the DX – the absolute difference between +DI and -DI
- Smooth DX using Wilder’s smoothing calculations to get ADX value
- Average ADX over chosen timeframe (typically 14) to filter noise
The details are complex, but traders mainly need to understand that ADX shows trend strength. The +DI and -DI show direction.
How to Use the ADX Indicator
The ADX is used to answer one simple question – how strong is the current trend? Traders mainly analyze the ADX in three ways:
1. ADX Crossovers
Crossovers of the ADX line can generate trade signals. For example, if ADX crosses up through 20, it signals the start of a trend. If ADX crosses down through 40, it signals the trend is weakening.
2. ADX Slope
The slope of the ADX line shows if trend strength is increasing or decreasing. An upwards sloping ADX indicates the trend is strengthening. A downwards slope signals a weakening trend.
3. ADX Value
Higher ADX values indicate stronger trends while lower values signal weak or ranging conditions. As a general guide:
- ADX below 20 shows no trend
- ADX 20-40 signals a moderate trend
- ADX above 40 indicates a strong trend
ADX Trading Strategies
The ADX can be combined with other indicators or used in a variety of strategies. Here are some examples:
Trend Following
Traders can go long when ADX rises above 20 and +DI is above -DI. Close trades when ADX falls below 40 or +DI crosses below -DI.
Range Trading
Enter short trades when ADX declines below 20 and price hits resistance. Cover shorts when ADX rises above 20 and price hits support.
Breakouts
Use ADX to confirm breakouts. Only trade breakouts when ADX is above 40, showing strong trend conditions. Ignore breakouts when ADX is below 20.
Filter
Use ADX to filter other indicators. For example, only take moving average crossover signals if ADX shows a strong trend (above 40).
ADX vs. Other Trend Indicators
The ADX compares to other popular trend indicators like the moving average and MACD:
- Moving Averages – ADX measures trend strength, while MAs identify direction and momentum. Use ADX to confirm MA signals.
- MACD – MACD is more sensitive than ADX for identifying early trend changes in price action. ADX quantifies how strong the new trend becomes.
No indicator is perfect. Combining ADX with directional indicators like moving averages or MACD can improve performance.
ADX Limitations
While useful, the ADX has some drawbacks traders should be aware of:
- Lagging – The ADX is not predictive and lags price action. Other indicators like MACD can signal turns sooner.
- Choppy markets – High ADX readings above 40 can persist even as a trend starts to weaken. ADX may take time to turn down in choppy conditions.
- Subjectivity – There are no definitive rules for interpreting ADX values. Traders must find settings and strategies that fit their own style.
- False signals – Like all indicators, the ADX can generate false signals which trigger losing trades. Use stop losses.
- Timeframe dependency – Optimal ADX settings depend on the trading timeframe. Faster settings suit shorter timeframes.
While a useful indicator, the ADX should be combined with other technical analysis tools and not used on its own.
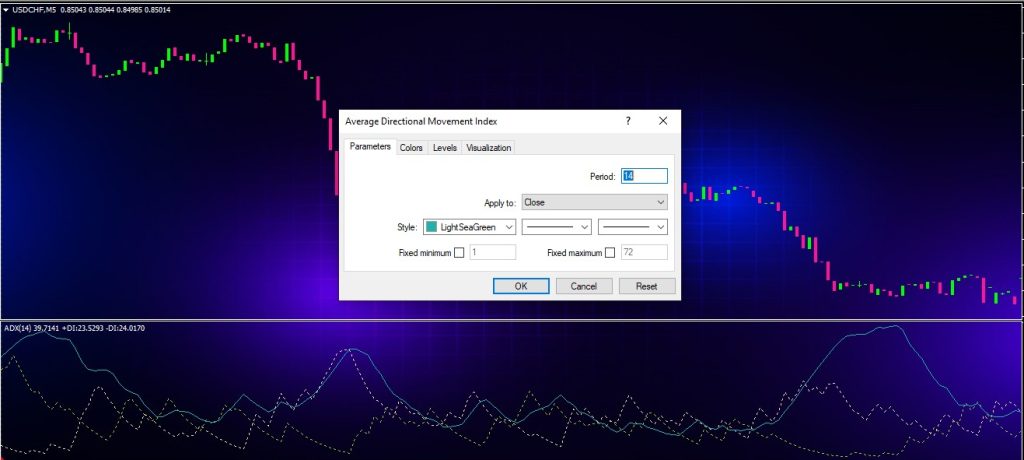
ADX Indicator Settings
The standard ADX settings are:
- ADX Period – 14 bars
- DI Period – 14 bars
Faster ADX settings will be more sensitive but also nosier. Slower settings (20 bars+) will be smoother but slower.
A 14-bar ADX maximizes responsiveness while filtering out excessive volatility and false signals. This is the most popular setting.
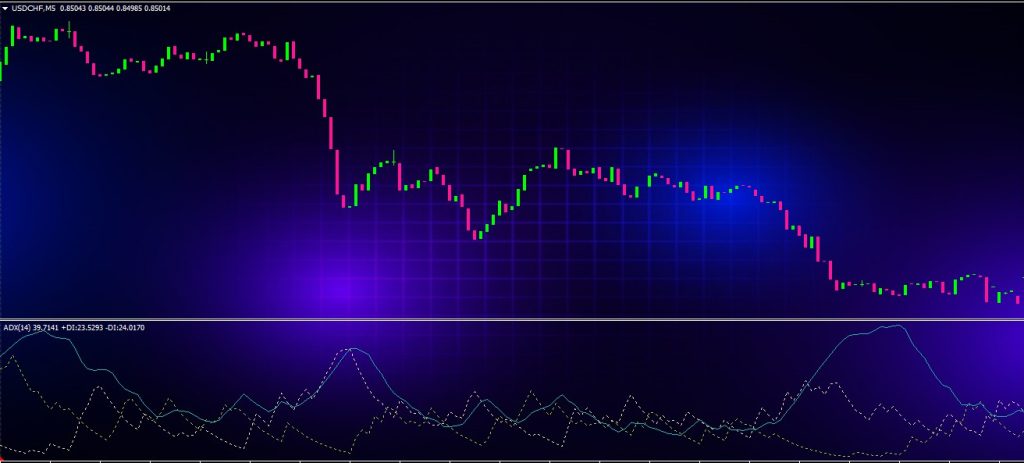
ADX vs +DI/-DI
It helps to also plot the +DI and -DI lines alongside ADX. This gives directional information to complement the trend strength shown by ADX.
If +DI is above -DI, it indicates an uptrend. If -DI rises above +DI, it signals a downtrend.
Monitoring crosses of the +DI and -DI lines can provide earlier entry/exit signals versus just the ADX crossing 20/40 thresholds.
ADX Trading System Examples
Here are two ADX trading system examples to demonstrate how it can be applied:
Trend Pullback Setup
Entry Rules:
- ADX > 40 (strong trend)
- Price pulls back to 20 period MA
- +DI/-DI in direction of trend
Exit Rules:
- ADX drops below 20
- Price closes beyond 50 MA
Ranging Market Fader
Entry Rules:
- ADX < 25 (weak trend)
- Price approaches Bollinger Band extremes
Exit Rules:
- ADX rises above 25
- Price moves to center of Bollinger Bands
These show how the ADX can be combined with other indicators and analysis to create structured trading systems.
Using ADX for Forex Trading
The ADX indicator is very popular amongst forex traders. Here are some tips for using it effectively for trading currencies:
- Gauge trend strength on major pairs during timeframes like the Daily and 4-hour charts
- Use a faster ADX setting (10 bars) on shorter timeframes below 1 hour
- Trade with the direction of the pair (buy when +DI is rising, for example)
- Look for ADX crossovers on lower timeframes to identify potential trend changes early
- Require an ADX reading of at least 25+ before taking any signals on smaller timeframes
- Be wary of ADX readings above 40+ lasting for extended periods during ranging markets
- Combine ADX with simple moving averages to define trade entry and exit points
The ADX is a versatile indicator that can improve any forex trading system when applied properly. Pay attention to both trend strength and directional clues when analyzing currency pairs.
Conclusion
The Average Directional Movement Index developed by Wilder remains as relevant today as decades ago for technically analyzing forex and stock markets. By quantifying trend strength down to a single simple value, the ADX becomes an invaluable tool for traders in filtering trades and managing risk.
No indicator is perfect on its own. The ADX lags price and can remain elevated during trend transitions. Combining the ADX with directional indicators can greatly improve performance. Traders who take the time to experiment with ADX settings and combinations tailored to their trading style can gain a reliable edge in gauging market trends.
Used wisely, the ADX indicator provides objective data to allow traders to make smart trading decisions and avoid unwise risks. In the hands of knowledgeable technicians, the ADX indicator becomes a powerful ally in navigating forex market trends.