

Envelopes are a technical analysis indicator used by forex traders to identify overbought and oversold conditions in the market. This versatile indicator can help traders determine potential entry and exit points, gauge market volatility, and spot trading opportunities across various time frames.
In this comprehensive guide, we’ll cover everything you need to know about using envelopes when trading forex. We’ll explore what envelopes are, how they are calculated, strategies for implementation, and tips for effective use of this tool. Whether you are a beginner looking to add envelopes to your trading toolkit or an experienced trader wanting to sharpen your skills, this guide has you covered.
What Are Envelopes?
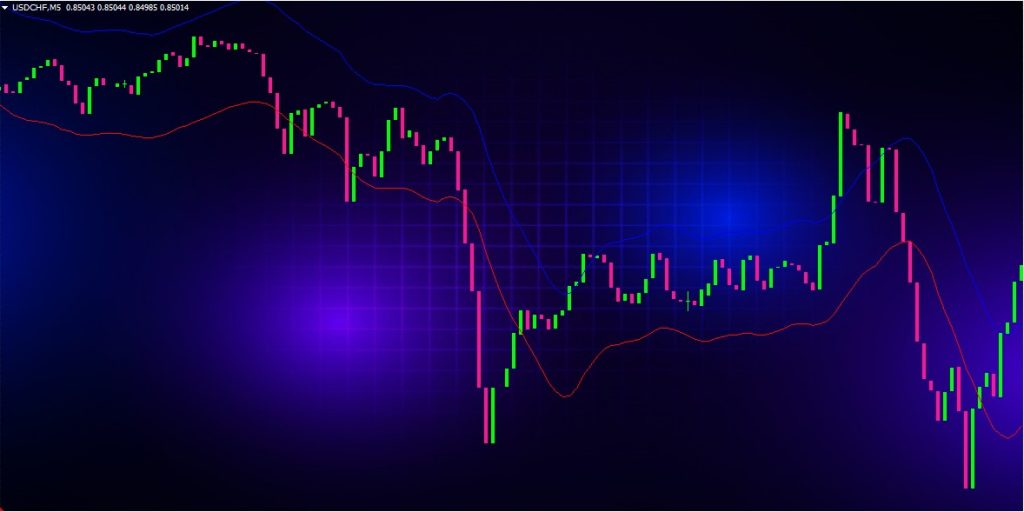
Envelopes are overlay lines plotted above and below a moving average line, creating an “envelope” around the average. Typically, envelopes utilize a simple moving average (SMA) as the middle band, with the upper and lower bands equidistant from the SMA based on a percentage or set point criteria.
For example, if constructing 20-period envelopes on a daily chart using a 2% distance, the upper band would be 2% above the 20-day SMA and the lower band 2% below. This establishes an envelope or trading channel around the SMA.
Envelopes serve as a volatility tool, widening during high volatility and contracting during low volatility. When prices breach the envelope bands, it can signal overbought or oversold conditions and potential turning points. Traders use envelopes to identify support and resistance levels, establish trading ranges, and time entries and exits.
How Are Envelopes Calculated?
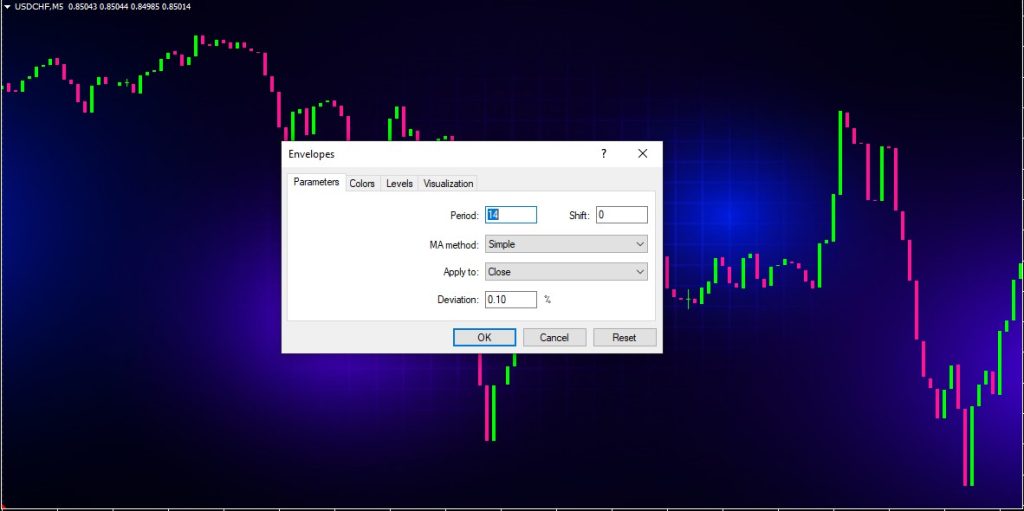
Envelopes are calculated using the following steps:
- Select a moving average – this will form the middle band. Common choices are 20-period or 10-period SMAs for short term trading.
- Determine percentage distance for bands – Typical values are 2-5% but can be customized. Wider bands (% distance) allow for more volatility.
- Calculate upper and lower bands – Take the moving average +/- chosen % distance and plot the upper and lower bands.
- As new closing prices emerge, the moving average and envelopes bands will adjust and shift according to the parameters.
5.Repeat calculation each new period, creating a dynamic envelopes indicator that responds to market conditions.
For example:
- 20-period moving average = 1.1500
- 2% distance chosen
- Upper Band = 1.1500 x 1.02 = 1.1730
- Lower Band = 1.1500 x 0.98 = 1.127
These values will update each period, plotting new envelopes bands around the moving average.
Envelopes vs. Bollinger Bands
Envelopes are often compared to their popular cousin, Bollinger Bands. While both utilize bands around a central moving average, there are some key differences:
- Band Distance – Envelopes use a fixed % distance from the MA, while Bollinger Bands use standard deviation to self-adapt the width.
- Band Shape – Envelopes create parallel lines above and below the MA. Bollinger Bands curve and bend based on volatility.
- Crossovers – Envelopes bands do not cross over one another. Bollinger Bands can crossover in periods of extreme volatility.
- Indicators – Bollinger Bands incorporate more information than envelopes, making them better at gauging volatility and identifying reversals.
So while envelopes and Bollinger Bands both seem similar at first glance, understanding these differences allows traders to utilize them more effectively.
Envelopes Trading Strategies and Techniques
Now that we’ve covered the basics, let’s explore some trading tactics using envelopes:
Identifying Overbought/Oversold Levels
One of the most common applications of envelopes is identifying potential overbought and oversold conditions. When price reaches the upper band, the asset may be overbought and ready for a pullback. Conversely, reaching the lower band could signal an oversold condition and upcoming reversal.
Traders watch for candlestick closes outside the envelopes bands to spot these exhausted moves. A close below the lower band indicates a potential long entry, while a close above the upper bands suggests a possible short position.
Trading the Envelope Channel
Envelopes outer bands can act as dynamic support and resistance levels. Some traders use the region between the bands as a trading channel – going long near the lower band and taking profits near the upper band.
As envelopes expand and contract, the channel adapts to changing market conditions. This technique works well during range bound or sideways markets. Stops are placed just outside the envelopes to contain risk.
Monitoring Trend and Volatility
Since envelopes respond directly to volatility, they can help traders gauge when trends are accelerating, consolidating, or reversing. Below are some guidelines:
- Expanding Envelopes – indicates rising volatility and an accelerating trend.
- Contracting Envelopes – suggests falling volatility and possible consolidation.
- Narrow Envelopes – imply low volatility environment. Use caution trading breakouts.
- Bands Pinching Moving Average – high chance of trend reversal near.
Analyzing the distance between the bands and their relation to the moving average reveals much about the trend and volatility.
Combining Additional Indicators
For greater signaling power, envelopes can be combined with other technical indicators like RSI, MACD, Stochastics, etc.
For example, overbought/oversold signals become stronger when confirmed by RSI exiting its upper or lower zones. Or MACD crossover above its signal line might verify upside envelope breakout.
Use these secondary indicators to validate envelope signals and avoid whipsaws. Divergence between indicators can also warn of potential reversals.
Entry/Exit Signals
Envelopes bands, when used with other analysis techniques, can provide trade entry and exit signals:
Entries:
- Long: Price closes below lower band (oversold), RSI < 30 (oversold), MACD histogram spikes above zero line.
- Short: Price closes above upper band (overbought), RSI > 70 (overbought), MACD histogram spikes below zero line.
Exits:
- Long Exit: Price hits upper band resistance, candlestick reversal patterns confirmed, MACD drops below signal line.
- Short Exit: Price hits lower band support, candlestick reversal patterns confirmed, MACD crosses above signal line.
Use envelopes for trade confirmation, then employ other indicators for timing entry and exit points.
Envelopes vs. Moving Averages
Envelopes incorporate moving averages in their calculation, but how do they compare as indicators?
Moving averages are lagging indicators, providing confirmation after a trend change. Envelopes add a predictive element, forecasting potential reversals when bands are hit.
Moving averages work in all markets. Envelopes perform better in volatile, trending markets where prices hit the bands more frequently.
Envelopes require more customization (moving average type, band width) but can be more versatile for strategies like trading ranges, breakouts, and volatility analysis.
Overall, envelopes leverage the smoothing benefits of moving averages and combine it with bands that anticipate potential turning points. Used together, moving averages complement envelopes very well.
Tips and Best Practices
Here are some tips for applying envelopes successfully:
- Match the moving average to your trading timeframe – 50-100 periods for long term, 20-30 periods for swing trading, 10-20 periods for day trading.
- Give envelopes room to breathe – Start with 2-3% band distance and adjust as needed. Too narrow defeats the purpose.
- Use percentage envelopes on instruments with high relative volatility, fixed envelopes on absolute volatility.
- Try various moving average types – SMA, EMA, SMMA, LWMA etc. Each has pros and cons.
- Combine envelopes with momentum oscillators (RSI/Stochastics), trend indicators (ADX/SMA) and volume.
- Envelopes work best in trending markets. Use cautiously in low volatility environments.
- Never rely solely on envelopes – incorporate other analysis methods and risk management practices.
With experimentation and practice, envelopes can become a valuable addition to your forex trading setup. Be responsive to what the market is signaling at all times.
Common Envelopes Trading Mistakes
While envelopes offer helpful trade signals, they can also lead to mistakes for undisciplined traders. Here are some errors to avoid:
- Acting on First Signal – Don’t immediately buy on first touch of lower band or sell on upper band touch. Wait for confirmation candle close outside bands.
- Over-Customization – Don’t obsess over finding the perfect settings. Simpler is better for effective envelopes.
- No Stop Loss – Always use a stop loss when trading envelope signals to control potential downside.
- Lack of Confirmation – Cross reference envelope signals with other indicators. Divergence often precedes trend changes.
- Assuming Levels Will Hold – Bands provide potential support/resistance but prices can still penetrate through. Use envelope hits as trade signals, not guaranteed reversal points.
Avoiding these common missteps will improve your probability of success implementing envelopes analysis.
Putting It All Together
Envelopes are a versatile technical tool that can support various forex trading strategies and styles. Here are some final tips for using envelopes effectively:
- Match envelope parameters to your trading timeframe and goals. Adjust as necessary.
- Use envelopes for trade signal confirmation, not as standalone analysis.
- Combine with oscillators, moving averages and volume indicators for greater precision.
- View envelopes as a volatility gauge and trend diagnostic tool.
- Implement sound risk and money management alongside envelope signals.
- Remain flexible, patient and responsive to shifting market conditions reflected in the envelopes.
With the right approach, envelopes can provide helpful trade signals and unlock key insights into forex price action. Add this tool to your trading toolbox today!
Conclusion
Envelopes are a versatile technical analysis indicator that can support forex traders across many markets and timeframes. By surrounding a moving average with upper and lower bands, envelopes help identify overbought/oversold levels, establish dynamic support and resistance zones, gauge volatility trends, and provide trade entry and exit signals when combined with other indicators. Traders can customize parameters to fit their strategy. While not a standalone system, integrating envelopes analysis into your broader methodology can give you an added edge. Use this guide to optimize envelopes in your forex trading and take your technical skills to the next level.