
Trading volumes are a crucial technical indicator for forex traders to analyze market activity and identify potential trade opportunities. The volumes indicator measures the number of units, often contracts, traded during a specified time period. Monitoring changes in trading volumes can provide vital clues into shifting supply and demand dynamics and the strength of a trend. This comprehensive guide will explain what the volumes indicator is, how to use it for forex trading, and key trading strategies to leverage volumes analysis for greater profits.
What is the Volumes Indicator?
The volumes indicator displays the total number or volume of trades made in a security or forex pair over a set timeframe. It is typically displayed as a histogram bar chart located at the bottom of a price chart. Each bar represents the trading volume for that time period.
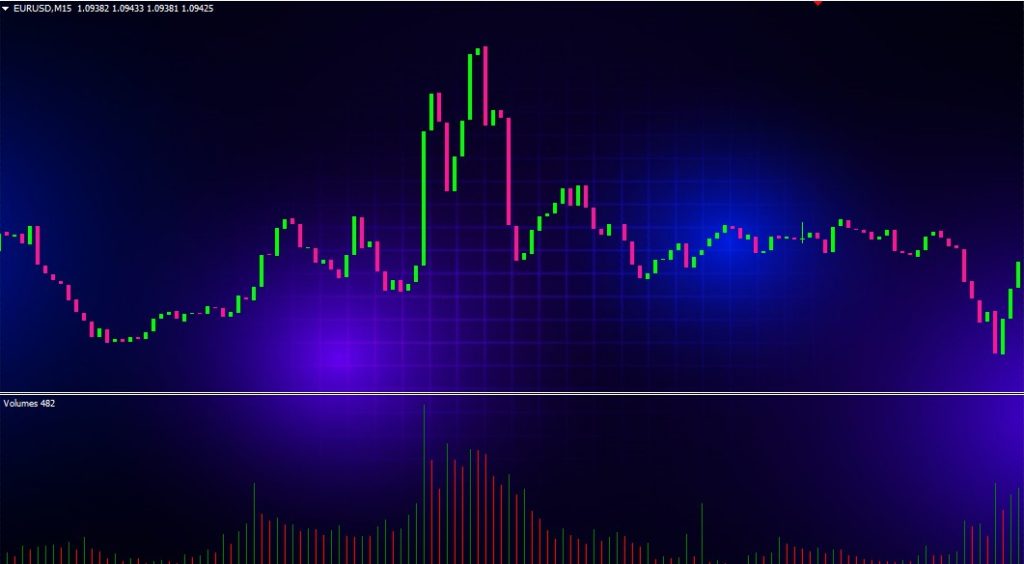
The volumes indicator reflects the total number of contracts traded, not the total value traded. For example, if 10 contracts of EUR/USD were traded in a 5 minute period, the volumes histogram would display a value of 10 for that period.
Higher volume bars indicate increased trading activity, while lower volume bars reflect decreased activity and interest. By analyzing volumes data, traders can identify periods of high versus low participation and draw conclusions about the strength or weakness of a price move.
Why Volume Matters
Trading volume provides crucial insights into the movements of smart money and professional traders. It reflects the degree of interest, confidence, and participation behind a price trend.
High trading volumes suggest a strong commitment behind a trend, signaling it may be safer to trade in the direction of the trend. Low volumes imply decreased conviction and potential exhaustion of a trend.
Volume precedes price. Price movements on increased volume may be a leading indicator of an emerging trend, while low volumes can signal potential reversals ahead. Analyzing volume surges or spikes helps traders recognize key support and resistance levels.
In summary, volume analysis validates the strength or weakness of price trends, signals changes in participation and conviction, and highlights support and resistance zones. Incorporating volumes into trading strategies can significantly improve timing and performance.
How the Volumes Indicator is Calculated
The volumes indicator measures the number or contracts traded during each period, typically bars on a chart. It totals the number of units traded on a tick-by-tick basis.
Each trading venue, whether an exchange or ECN, records the volume data and provides it as part of their market feed. Charting platforms then display volumes as a bar, histogram, or line chart.
The calculation logic is straightforward:
Copy code
Total Volume = Sum of all contracts traded per time period
For example, the 5 minute volume would equal the total number of contracts traded in those 5 minutes. The daily volume sums all contracts traded that day.
Volumes are commonly measured for intervals like 1 minute, 5 minutes, 15 minutes, 30 minutes, 1 hour, 4 hours, daily, and weekly. Intraday traders will consult shorter timeframes like 5 or 15 minutes, while longer-term traders may analyze daily, weekly or monthly volumes.
It is critical to understand volumes are aggregated per timeframe. Comparing the volumes between a 5 minute and 60 minute chart would be an apples to oranges comparison. Consistency in timeframe analysis is key.
How to Read and Interpret Volumes
When incorporated into a trading strategy, volumes should not be looked at in isolation. Volume levels and changes must be assessed relative to recent history and against price action.
Here are key methods to properly read and interpret volumes data:
1. Compare Volume Levels: Analyze current volume in relation to past volume levels. Volume well above or below the average often signals increased conviction behind trends.
2. Monitor Increases/Decreases: Rising volumes indicate increased interest, while declining volumes reflect waning enthusiasm. Significant changes often precede price breakouts or reversals.
3. Identify Spikes: Look for sharp surges well above previous bars. Spikes reveal dramatic shifts in trading activity and may signal breakouts.
4. Volume Leads Price: Volume changes tend to precede price moves, acting as a leading indicator of volatility or reversals.
5. Confirm Breakouts: High volume on price breakouts increases the validity of true trend changes. Low volume breakouts are prone to failure.
6. Assess Volatility: Periods of increased volatility are generally accompanied by higher trading volumes. Lower volatility reflects decreased interest.
7. Spot Divergences: Divergences between volume and price may signal upcoming retracements or reversals.
By incorporating these volume analysis methods, traders can better time entries and exits around price action. Next we will explore specific trading strategies using volumes.
Volumes Trading Strategies for Forex
Monitoring volumes activity should play a central role in most trading strategies and systems. Here are some of the top ways traders can leverage volumes analysis:
Trade in Direction of Volume Trends
Increasing trade volumes confirm the strength of an emerging trend. Decreasing volumes signal potential exhaustion. Traders are best served entering trends in the direction of rising or elevated volume.
For example, when a surge of volume accompanies a breakout above resistance, it confirms growing upwards momentum. Traders would look to buy on pullbacks, placing stops below previous swing lows.
Conversely, fading volume warns of weakening momentum. Seeing volume decrease as price reaches a resistance level suggests the barrier is holding. Traders may anticipate a reversal lower, selling short with a stop above the recent high.
Use Volume to Confirm Price Breakouts
Volume validation can prevent traders from prematurely buying breakouts that lack genuine conviction. Analyzing volume on breakouts highlights when increased participation is supporting a new trend.
Monitor volume levels on key support and resistance tests. If volume rises significantly on a resistance break, it adds credibility to the breakout. Lackluster volume on the breakout often leads to failures.
The same applies with downside breakouts below support. Volume confirming the breakdown indicates bearish momentum in place. Weak volume hints the support level may hold firm.
Identify Exhaustion Volume Signals
Following extended trend moves, monitoring for exhaustion volume patterns help traders avoid overstaying a trend. Volume divergence and dry up are two such patterns.
Volume divergence occurs when price is moving in one direction while volume trends the opposite way. This demonstrates waning momentum that often precedes corrections.
Volume dry up takes place when a trend move continues higher or lower on shrinking volume. The depleted interest forewarns of potential trend reversals as participation dries up.
Use Volume to Spot Trend Reversals
Combining price action analysis with volumes can effectively identify trend reversals. For example, a reversal candlestick pattern on significantly higher volume indicates a greater probability of a true trend change.
Volume can also help confirm trend reversals. If volumes rise as price breaks below prior swing lows, it adds credibility to the reversal and favors further downside follow through.
Additionally, traders may look for expanding volume on corrective moves that signal a resumption of the main trend. Increasing volume on pullbacks hints the trend will continue.
Focus on Volume Spikes
Volume spikes represent a sudden and sharp increase in trading activity. They reflect a strong influx of new participants. Spikes often lead to significant volatility expansion.
Traders can use volume spike signals to anticipate potential breakouts. If a volume spike emerges near resistance, be alert for an upside breakout. Downside volume spikes may precede breakdowns below support.
It is also important to understand the context around volume spikes. Spikes near swing highs or lows are more significant than those in the middle of ranges. Also analyze whether volume is spiking in the direction of the trend or countertrend.
Trade Retracements to the Volume Mean
Volume history provides helpful context on support and resistance levels. Areas of elevated volume in prior trading tend to draw price back as volume regresses back to its mean.
For example, after a volume explosion, there will inevitably be periods of decreased volume. This provides swing trading opportunities back to the volume average.
Traders can isolate high volume zones that correspond with support or resistance levels. Buying as volume pulls back on retests of these areas capitalizes on the volume mean reversion tendency.
The volumes indicator offers traders an invaluable window into order flow. While price shows where a market is trading, volume reveals the degree of participation driving those prices. Incorporating volume analysis into trading strategies can significantly improve timing, confirmation, and performance.
Common Trading Signals with Volume Indicators
Here is a summary of the most common trading signals produced by analyzing volumes:
- Increasing Volume in Direction of Trend – Confirms robust momentum in place. Favors entries in trend direction.
- Decreasing Volume in Direction of Trend – Signals potential exhaustion and trend reversal ahead.
- High Volume on Breakouts – Validates true change in market participation. Adds credibility to new trends.
- Low Volume on Breakouts – Breakouts prone to fail without new interest. Favors pullback scenarios.
- Volume Divergence – Trend weakness when price moves counter to volume. Flags possible reversals.
- Volume Spikes – Surges in volume reflect influx of new traders. Likely signals volatility expansion.
- Volume Dry Up – When trending moves continue on declining volume, signals exhaustion.
- Expanding Volume into Support/Resistance – Volume increasing into key levels indicates strength of levels.
- Reversion to the Volume Mean – High volume areas draw price back as volume regresses to averages.
Optimizing the Volumes Indicator Settings
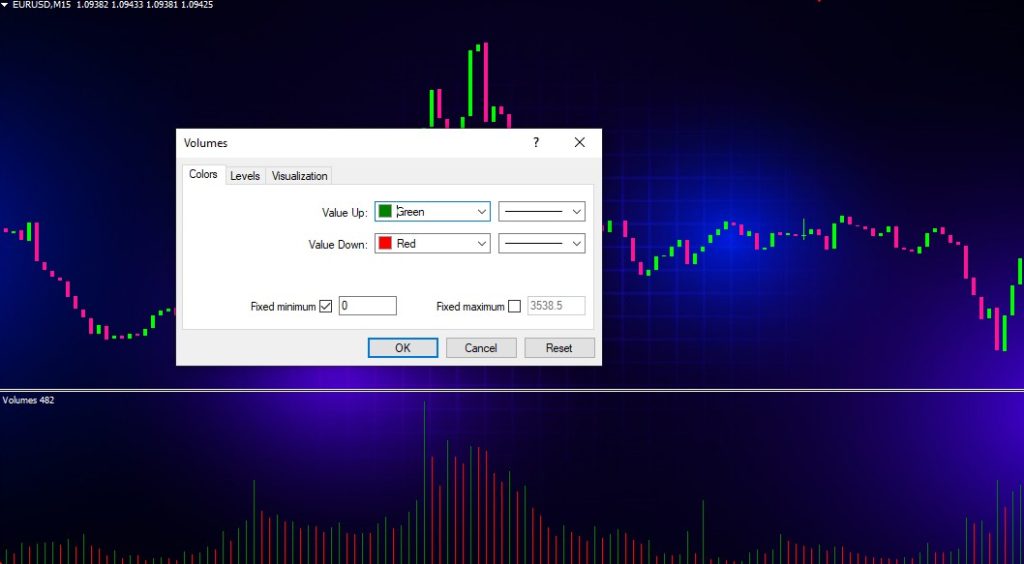
The volumes indicator is highly customizable across trading platforms. Traders can fine tune the indicator settings to best visualize volumes data. Here are the key settings options:
Volume Type – Select between tick volumes, real volumes, or exchange volumes depending on data source. Tick volumes recommended for forex.
Length – Specifies the number of periods or bars to display. Longer lengths show more historical volume.
Visibility – Toggles visibility of the volumes histogram, moving average, or both.
Position – Sets volumes histogram location on the price chart.
Scale – Adjusts scale volume units or allow auto-scaling.
Color – Customizes color of volumes histogram and moving average.
Volume MA – Adds simple or exponential moving average of volume. Helps smooth data.
Alerts – Set volume-based alerts for increased trading opportunities.
Optimizing these settings helps traders view volumes data in the most insightful way. Focus on lengths relevant to your trading timeframe and highlighting notable volume surges or spikes.
Volumes Indicator vs Volume MA: What is the Difference?
The volumes indicator and volume moving average are related but distinct. The key differences:
- Volumes Indicator – The raw volumes histogram showing total contracts traded per bar or period.
- Volume Moving Average – Smooths volumes data to identify trends or provide signals. Commonly 20 or 50 period.
- Volumes Indicator – The unfiltered volume data aggregated over a timeframe.
- Volume MA – Calculates average volume level over a set lookback period. Acts as a filter.
- Volumes Indicator – Useful for visualizing spikes, surges, and relative activity.
- Volume MA – Identifies sustained volume increases or decreases. Can generate trading signals.
- Volumes Indicator – Provides raw data source for analysis.
- Volume MA – Processes volumes data into trending indicators and oscillations.
While the volumes indicator displays the core data, volume moving averages transform that data into trending signals that may provide trading clues. Using both together provides a more complete volume analysis.
Volumes Indicator vs Price Indicators
Price indicators and volumes indicators provide related but unique information:
- Price Indicators – Measure trend, momentum, volatility, cycles based on price values.
- Volumes Indicators – Reflect level of market participation and conviction behind prices.
- Price Indicators – Show where prices have traveled and may be heading.
- Volumes Indicators – Reveal who is trading and the degree of interest.
- Price Indicators – Identify trend direction, overbought/oversold levels, reversals.
- Volumes Indicators – Confirm whether trends are strengthening or weakening.
- Price Indicators – Lead volumes indicators. Price moves first, then volume reacts.
- Volumes Indicators – Follow price action. Rising volume drives prices higher.
Price shows where the market is trading now. Volume exposes whether traders will push or fade those moves. Combining price and volume analysis provides a more complete view.
Volumes Indicator Limitations
While the volumes indicator is a critical aspect of technical analysis, traders should be aware of its potential limitations:
- Indirect Measure of Participation – Volume shows activity but not precise count of buyers/sellers.
- Can be Volatile – Jumps sharply on news events or large institutional trades.
- Variable Quality of Data – Depends on accuracy of volumes reporting from each venue.
- Does Not Account for Trade Size – Small and large transactions count equally.
- Not Applicable for All Assets – More relevant for liquid markets with ample daily volumes.
- Lagging – Current volume reflects past participation. May not signal reversals early.
- Differs By Timeframe – Volume reads vary significantly on short versus long-term charts.
Even with these constraints, trading volumes remain an extremely useful indicator. Just be sure to apply volumes analysis in the context of other technical factors.
Volumes Trading Tips
Here are some key trading tips when harnessing volumes analysis:
- Compare current volume against recent history, not against absolute levels. Look at volumes in relative terms.
- Focus on notable volume surges or spikes that stand out from previous activity. Isolate where enthusiasm is entering or exiting.
- Use volumes for confirmation of price breakouts, reversals, and support/resistance tests. Volume adds credibility to price signals.
- Remember volume is a lagging indicator. Trades based on volume changes will enter after much of the move. Use for trend confirmation.
- Analyze volume in conjunction with other indicators like price action, sentiment, volatility analysis to gain greater conviction in trade signals.
- Always consider volume in terms of broader market conditions and fundamentals. Increased volume in a risk-off environment has a much different implication than during risk-taking speculative periods.
- Adopt a multi-timeframe approach to analyzing volume. Assess longer-term volume trends as well as short-term activity.
By mastering the intricacies of trading volumes, forex traders can gain an informational edge and significant advantage for enhancing trading performance.
Conclusion
The volumes indicator reveals invaluable insights into shifting supply and demand dynamics within financial markets. Assessing trading volumes enables traders to gauge participation, enthusiasm, and conviction behind trends. Combining price action with volume analysis can confirm emerging trends, identify exhaustion moves, and lead to higher probability trading.
This guide has provided a comprehensive overview of volumes indicator characteristics, calculations, strategies, and tips for forex trading. Traders can now leverage volumes to validate high probability trade entries and exits. However, volumes should not be used alone. Integrate volumes with comprehensive technical analysis, price action, and market sentiment.
The key takeaway is that price shows where a market is moving, but volume reveals the degree of participation driving that move. Consulting volumes, in addition to price indicators and patterns, will provide a more complete picture and lead to more informed trading. By mastering the ability to monitor and interpret volumes, traders can significantly enhance performance.