
The commodity channel index (CCI) is a versatile technical indicator that traders often utilize to determine when an asset is potentially overbought or oversold. Developed by Donald Lambert in the late 1970s, the CCI has stood the test of time and remains one of the most popular indicators used today.
In this comprehensive guide, we’ll cover everything you need to know about the commodity channel index, including:
What is the Commodity Channel Index?
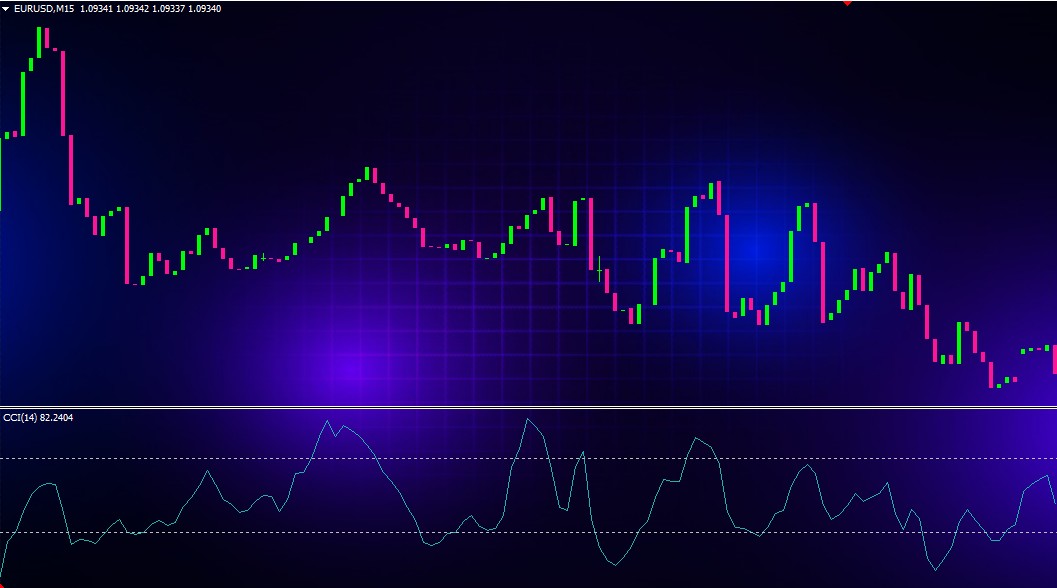
The commodity channel index is an oscillator that measures an asset’s deviation from its statistical mean. It is plotted on a separate window below the price chart and fluctuates between positive and negative values.
The CCI calculates the difference between the asset’s typical price and its simple moving average over a defined lookback period. The lookback period is usually set to 20 days but can be adjusted based on the desired sensitivity.
Key Takeaways:
- Oscillator that identifies overbought and oversold levels
- Measures deviation from statistical mean price
- Fluctuates above and below 0
- Lookback period typically 20 days
How is the Commodity Channel Index Calculated?
The commodity channel index formula is a bit complex but can be broken down into a few steps:
- Calculate the Typical Price for each period: (High + Low + Close) / 3
- Compute the 20-period simple moving average of the typical price
- Determine the mean absolute deviation (MAD) from the 20-period moving average
- Calculate the commodity channel index with the following formula:
CCI = (Typical Price – 20-period SMA) / (.015 x Mean Absolute Deviation)
The .015 constant in the formula is used so that approximately 70-80% of CCI values would fall between -100 and +100. This normalization allows overbought/oversold levels to be compared across various assets.
What Does the CCI Tell You?
The commodity channel index is used to identify new trends and warn of extreme conditions. Here’s what to look for:
- Values above 100 indicate an overbought condition. The asset may be ready for a correction.
- Values below -100 signal an oversold condition. A potential reversal could be developing.
- Crossing above +100 can act as an early entry signal when a new uptrend is developing.
- Crossing below -100 can signal the start of a potential downtrend.
- Divergence from price action can foreshadow a trend change. For example, price reaching new highs while CCI forms lower highs.
How is the Commodity Channel Index Best Used?
The CCI is versatile and can be applied across various trading strategies and timeframes. Here are some examples of how traders utilize the indicator:
Identifying Overbought/Oversold Levels
Traders look for the CCI moving into overbought territory above +100 or oversold levels below -100 to gauge potential long or short trades. Short-term mean reversion strategies work well with the CCI.
Spotting New Trends Early
The CCI crossing above +100 or below -100 can signal the start of a new uptrend or downtrend respectively. Traders can use these crossover points to enter early before a big price movement.
Confirmation for Other Indicators
The overbought/oversold signals from the CCI can be used to confirm trading signals given by other technical indicators, such as MACD crossovers or trendline breaks.
Divergence Signals
Divergence between the CCI and price action is a strong indicator that the current trend may be losing strength and ready to reverse. Traders watch for divergence on the CCI before taking contrarian trade entries.
Multi-Timeframe Analysis
Monitoring the CCI on different timeframes (ex: 5m, 15m, 1hr) can provide insight into the broader trend as well as smaller counter-trend retracements.
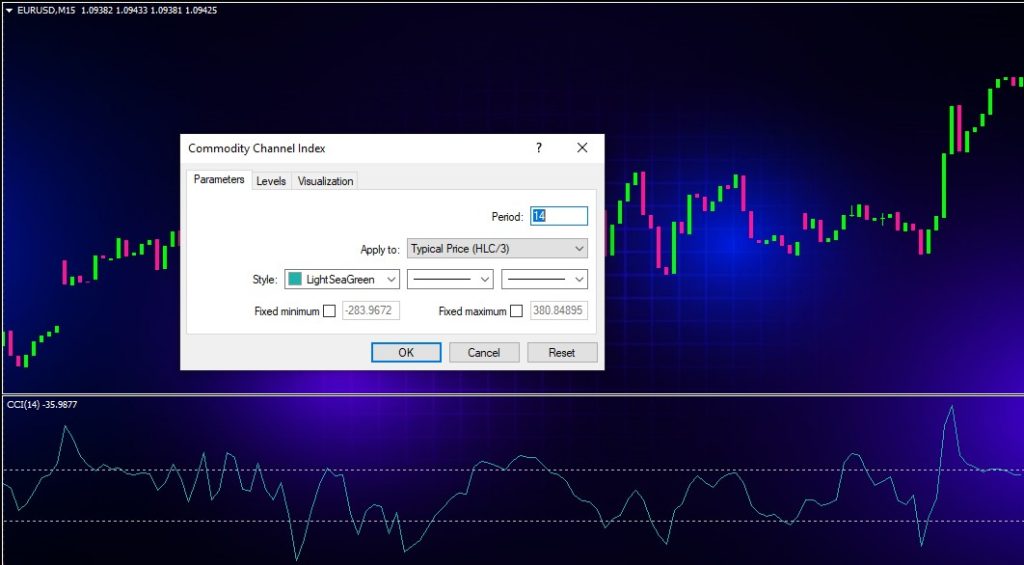
Optimizing CCI Parameters and Settings
The standard CCI settings utilize a 20-period lookback and constants set for commodities trading. However, traders can fine-tune the indicator for different assets and timeframes.
Lookback Period
A shorter lookback period of 5-10 will make CCI faster and more sensitive. A longer 30-50 period lookback will smooth out fluctuations.
Overbought/Oversold Levels
Some traders adjust the default 100/-100 overbought/oversold values higher or lower based on the asset’s volatility. For example, 80/-80 for low volatility stocks.
Timeframe
CCI signals should be confirmed on multiple timeframes when possible. Use shorter timeframes for entry triggers and longer for trend confirmation.
Asset Class
Each asset class has different volatility profiles. Fine-tune CCI parameters separately for commodities, stocks, forex, etc.
Trading with CCI: Strategies and Examples
Now let’s examine how traders are applying the commodity channel index in their own systems and strategies:
CCI Pullback Strategy
- Identify new uptrend when CCI crosses above +100
- Enter long trade as price pulls back to +100 CCI level
- Place stop-loss below recent swing low
- Take profits at next CCI overbought peak or trailing stop
CCI Peak-Trough System
- Go long when CCI crosses up through +100 (peak)
- Close 50% of position when CCI reaches peak overbought level
- Trail the rest until CCI crosses back down through +100
- Reverse to a short trade when CCI crosses below -100 (trough)
CCI Divergence Setup
- Confirm uptrend with rising price and CCI over +100
- Watch for bearish divergence: price making new high but CCI not
- Enter short when CCI breaks back below +100 level
- Manage trade with stops under recent higher lows
CCI Zone Fade
- Identify CCI trading in bounded zone between +100 and -100
- Buy near -100 and take profits near +100
- Short near +100 and cover near -100
- Use tighter stops if CCI breaks out of zone
Pros and Cons of the Commodity Channel Index
Let’s summarize the key benefits and limitations traders should keep in mind when using CCI:
Pros
- Quickly identifies overbought/oversold levels
- Can signal new trend starts early
- Versatile for many strategies and timeframes
- Normalized scale allows comparison across assets
Cons
- Generates many false signals in choppy or sideways markets
- Divergences don’t always precede trend changes
- Not ideal for very low volatility environments
- Multiple parameters require optimization
Overall, the CCI indicator works best when combined with other technical analysis techniques such as trendlines, chart patterns, and additional oscillators. Use the CCI mainly for trade entry/exit triggers and overbought/oversold readings rather than acting on signals in isolation.
Conclusion
The commodity channel index has shown itself to be a robust indicator that has remained useful decades after its invention. When applied properly, the CCI can provide immensely valuable signals for timing entries, exits and identifying potential trend changes.
However, like all indicators, the CCI has flaws and weaknesses. False signals and divergence failures are common. To become a truly skilled CCI trader takes screen time observing how the indicator acts across different markets and timeframes.
Combining the commodity channel index with price action analysis and other indicators will lead to much more accurate trading. Going forward, pay attention to how the CCI is behaving relative to current market conditions rather than simply reacting to a crossover.
With practice, the commodity channel index can take your technical trading skills to the next level. Use this guide as a reference and template as you continue exploring this powerful indicator.