
The DeMarker indicator, also known as DeMarker Oscillator, is a technical analysis tool used to identify potential trend reversals and overbought or oversold conditions in the forex market. Created by Thomas DeMark in the early 1990s, the DeMarker indicator has become a widely used indicator among forex traders looking to capitalize on major shifts in market momentum.
In this comprehensive guide, we’ll explore what the DeMarker indicator is, how it’s calculated, how to use it for trading forex, the basics of analyzing DeMarker signals, and the advantages and limitations of this indicator. Whether you’re a novice or experienced trader, read on to learn how DeMarker can complement your trading strategy.
What is the DeMarker Indicator?
The DeMarker indicator, named after its creator Thomas DeMark, belongs to the oscillator family of technical indicators. Oscillators are used to identify overbought and oversold conditions and potential trend reversals.
Specifically, the DeMarker indicator compares the most recent closing price to the asset’s trading range over a set lookback period. The lookback period is usually 14 periods, although this can be adjusted based on the chosen timeframe.
The DeMarker formula is:
DeMarker = (Highest High – Close) / (Highest High – Lowest Low)
Where:
Highest High = The highest high over the lookback period Lowest Low = The lowest low over the lookback period Close = The current period’s closing price
The resulting value fluctuates between 0 and 1. The closer to zero, the more overbought the asset. The closer to 1, the more oversold the asset. Divergence from these overbought/oversold levels indicates potential trend changes.
How to Use the DeMarker Indicator for Forex Trading
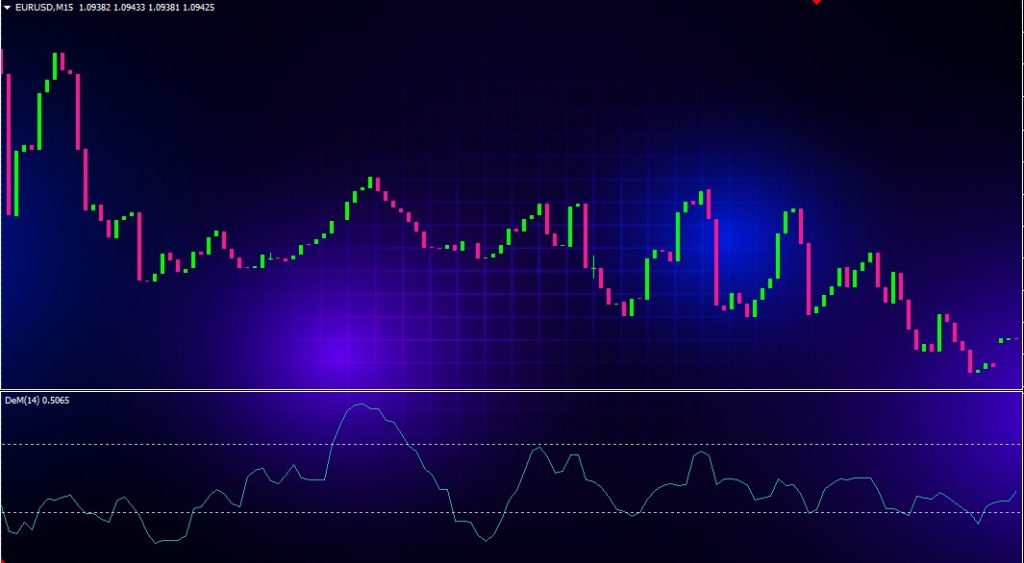
When added to a forex price chart, the DeMarker indicator appears as an oscillating line that fluctuates between 0 and 1. There are several signals traders look for when using the DeMarker that may suggest a trend change:
Overbought/Oversold Levels
- Values above 0.8 indicate an overbought asset, while values below 0.2 indicate an oversold asset. Price may reverse when reaching these extremes.
Crossovers
- When DeMarker crosses above 0.8, it signals overbought conditions and potential bearish reversal. When crossing below 0.2, it signals oversold conditions and potential bullish reversal.
Divergence
- Divergence occurs when price makes a new swing high/low but DeMarker fails to reach a new extreme. This suggests waning momentum and potential trend exhaustion.
Centerline Crossovers
- Crossovers above/below the 0.5 centerline suggest a shift from bullish to bearish sentiment or vice versa.
Change in Direction
- When DeMarker turns from an upward path to downward or vice versa, it may signal an impending trend change.
How to Read and Analyze DeMarker Signals
When using DeMarker in your forex trading strategy, focus on the following elements for analyzing signals:
Overbought/Oversold Levels
- Values reaching above 0.8 or below 0.2 indicate potential price exhaustion. Look for corresponding price reversal patterns for confirmation.
Divergence
- Divergence signals require clear separation between indicator and price. The wider the divergence, the stronger the signal.
Crossovers
- Crossovers should close decisively above/below key thresholds (0.2, 0.5, 0.8). False crossovers are common so wait for confirmation.
Volume
- High trading volume confirms real momentum shifts. Lack of volume may indicate false signals.
Previous Swing Highs/Lows
- Draw trendlines connecting previous swing highs and lows. Breaks of these trendlines combined with DeMarker signals validate trend changes.
Other Confirmation
- Look for confirmation from other indicators (e.g. moving averages, MACD) before acting on DeMarker signals. Confluence strengthens the probability of a real trend shift.
DeMarker Trading Strategies and Techniques
Here are some of the most common ways traders utilize the DeMarker indicator in their trading:
Overbought/Oversold Bounces
- Trade the reversal when DeMarker reaches above 0.8 (oversold) or below 0.2 (overbought). Place stop just outside recent swing high/low.
Centerline Crossovers
- Buy when DeMarker crosses above 0.5 signaling upward momentum. Sell when crossing below 0.5 for downward momentum.
Divergence Fades
- Fade the price extreme when divergence suggests waning momentum. Enter on confirmation of trendline break.
Trend Trading
- Use DeMarker to determine overall trend bias. Long above 0.5 and short below 0.5 until a centerline crossover.
Momentum Confirmation
- Add DeMarker to other momentum indicators (e.g. RSI) for confirmation of overbought/oversold readings.
Breakout Trading
- Look for DeMarker extremes right before major support/resistance. Trade breakouts with momentum confirmed by DeMarker.
Advantages of Using the DeMarker Indicator
The DeMarker indicator offers several advantages for forex traders:
- Effective at identifying overbought/oversold conditions – One of the best applications of DeMarker is spotting price exhaustion.
- Smoother than many oscillators – The DeMarker line has less volatility and fewer false signals than other oscillators.
- Can confirm trend momentum – Useful for gauging whether trends have strength or are losing momentum.
- Objective indicator – As an indicator based on a mathematical formula, it removes subjectivity and emotion from analysis.
- Versatile applications – Can be used for reversal trades, identifying overall trend, momentum confirmation, and more.
- Easy to interpret – With just one line, DeMarker has a simple visual appearance and clear signals.
Limitations of the DeMarker Indicator
While advantageous in many respects, the DeMarker indicator does have some limitations to keep in mind:
- Lagging indicator – Since it uses past data, signals will lag price action which makes timing entries difficult.
- Many false signals – Whipsaws and false signals are common, so confirmation from other indicators is recommended.
- Subject to repainting – The final DeMarker values are sometimes recalculated retroactively as new data comes in.
- Not ideal for low liquidity pairs – Volatility and lack of trading volume can distort DeMarker readings. Best for major pairs.
- No standalone system – Performs best when combined with other technical/fundamental analysis. Not ideal for purely mechanical trading.
- Requires parameter optimization – 14 periods may not be the ideal setting across all pairs and timeframes. Optimization is needed.
DeMarker vs. Other Oscillators
DeMarker belongs to the oscillator family along with popular indicators like RSI, Stochastics, and MACD. Here’s how DeMarker compares:
DeMarker vs. RSI
- RSI aims to identify overbought/oversold levels specifically in the context of recent price action. DeMarker compares current price to the entire trading range.
- RSI is best suited to trading ranges, while DeMarker excels in trending markets.
- RSI is more volatile with more frequent trade signals while DeMarker is slower and smoother.
DeMarker vs. Stochastics
- Like stochastics, DeMarker signals overbought/oversold levels. Stochastics suffers from lag due to its moving average components while DeMarker is faster.
- Stochastics is more sensitive with more signals while DeMarker has fewer false crosses.
DeMarker vs. MACD
- MACD is a trend-following momentum indicator, while DeMarker is an oscillator aimed at identifying extremes.
- MACD is better for gauging trend direction and strength. DeMarker is better for spotting reversals.
- MACD generates more frequent trading signals while DeMarker focuses only on the most significant opportunities.
How to Add DeMarker to Your Trading Chart
Adding the DeMarker indicator to your forex chart is simple in just a few steps:
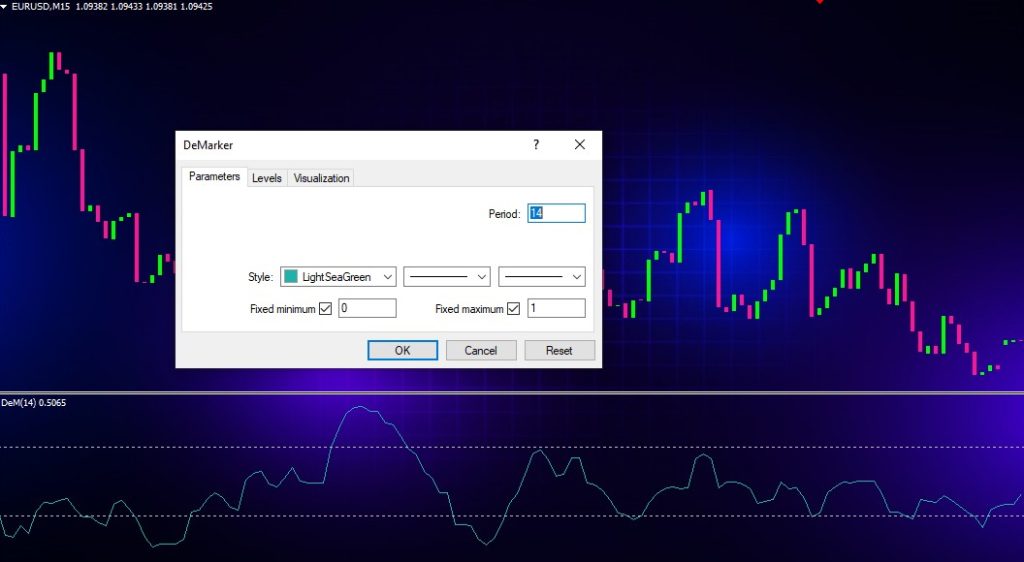
- Open the chart in the trading platform (e.g. MetaTrader 4 & 5)
- In the Navigator panel, click on Indicators
- Search for “DeMarker” or “DeM”
- Double click on DeMarker to add it to the chart
- By default, the parameters will be set to 14 periods which is the standard lookback period
- The indicator will now display as a line oscillating between 0 and 1 on the chart
- Refer to the indicator signals described earlier to analyze potential trades
- Consider adding a 21 period simple moving average to act as a signal line
DeMarker Trading Tips and Strategies
Here are some tips for effectively using DeMarker in your trading:
- Use on higher timeframes (4H, daily, weekly) for the most reliable signals
- Focus on trading in the direction of the prevailing trend
- Wait for closes above/below key levels (0.2, 0.5, 0.8) for confirmation
- Combine DeMarker with other indicators like moving averages for confirmation
- Watch for divergence with price to catch trend reversals early
- Optimize the lookback period. 14 is not necessarily the best setting for all pairs.
- Adjust parameters to match your trading style (e.g. shorter lookback for more signals)
- Use DeMarker for all markets, not just forex (stocks, indices, commodities, etc)
- Account for trading costs – oscillators work best with tight stops and frequent trades
Conclusion
The DeMarker indicator is a versatile oscillator that can aid forex traders in confirming trend momentum, identifying optimal entry and exit points, and spotting potential trend reversals. However, like all indicators, it should not be used as a standalone system but rather combined with other technical and fundamental analysis.
Used properly, the DeMarker indicator can provide high-probability trading opportunities in alignment with the overall trend. By mastering the signals, parameters, and trading strategies outlined here, traders can confidently incorporate DeMarker into their forex trading plan.