
The relative strength index (RSI) is one of the most popular momentum indicators used in technical analysis of the financial markets. Developed by J. Welles Wilder Jr. in the late 1970s, the RSI has stood the test of time and remains an invaluable tool for traders looking to identify overbought and oversold conditions.
What is the Relative Strength Index (RSI)?
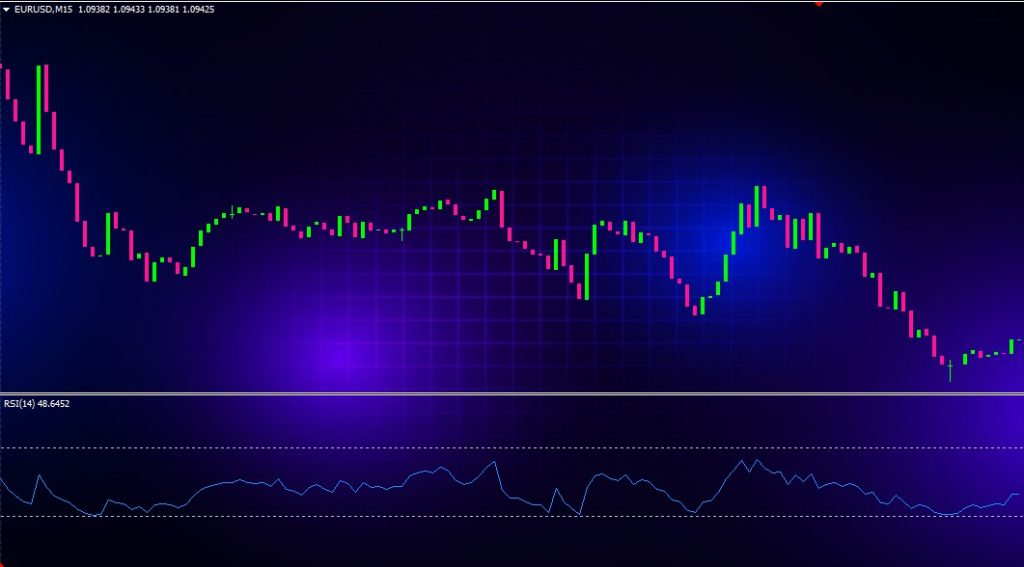
The relative strength index is a momentum oscillator that measures the speed and rate of change of price movements for a financial asset. It oscillates between 0 and 100, providing traders with overbought and oversold signals.
Specifically, the RSI compares the average price gains on up days (closing price higher than opening price) with the average price losses on down days (closing lower than opening). The ratio of these averages gives the relative strength, which is then converted into an index reading.
How is the RSI Calculated?
The RSI calculation uses the following steps:
- Calculate the average gain of up periods over the time period (typically 14 periods).
- Calculate the average loss of down periods over the time period.
- Divide the average gain by the absolute value of the average loss. The result gives the relative strength.
- Take the relative strength value and convert it into an RSI reading using this formula:
RSI = 100 – (100 / (1 + RS))
For example, if the average gain over 14 periods was 10 and the average loss was -8, the relative strength would be 10 / -8 = -1.25. Plugging this into the RSI formula above gives an RSI reading of 56.
RSI values range from 0 to 100. An asset is considered overbought when the RSI is above 70 and oversold when below 30.
Key Features of the RSI Indicator
- Range-bound: The RSI oscillates between 0 and 100, making it easy to identify overbought (>70) and oversold (<30) levels.
- Leading indicator: The RSI often tops or bottoms ahead of the actual market, signalling potential trend reversals.
- Divergence: The RSI sometimes forms a divergence from price action, foreshadowing a trend change.
- Versatile: The RSI works equally well on all time frames and financial instruments like stocks, currencies, commodities, and indices.
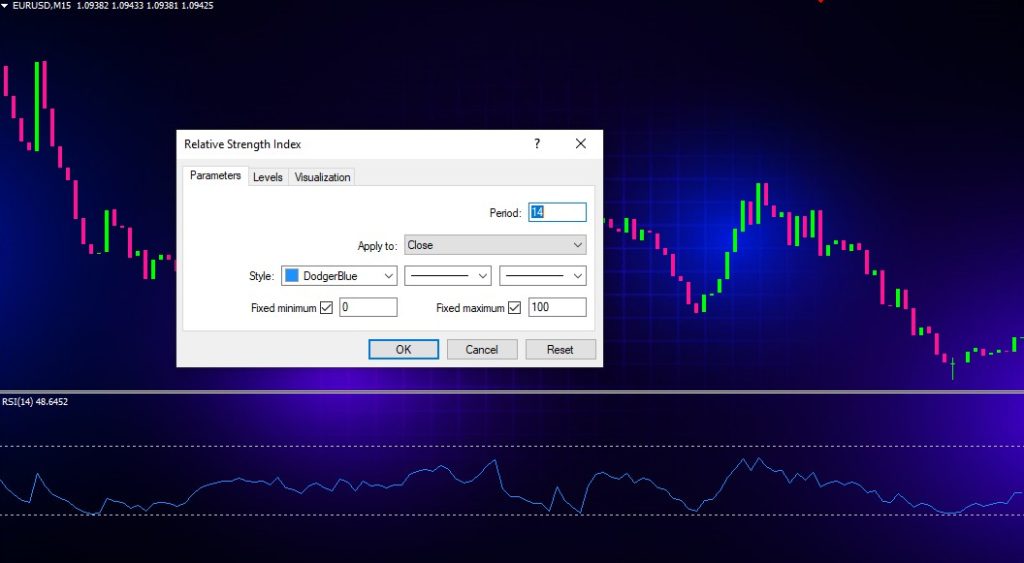
- Customizable: Traders can tweak the RSI parameters like the lookback period to suit their trading style. The default is 14 periods.
How to Read and Interpret the RSI
When interpreting the RSI, traders generally look for these key things:
Overbought and Oversold Levels
The most basic use of the RSI is to identify overbought conditions above 70 and oversold conditions below 30. This indicates the asset may be ready for a pullback or reversal.
For example, if a stock has been in a strong uptrend and then its RSI moves above 70, it signals the stock is overextended and due for a correction lower.
Trend Strength
RSI readings above 50 indicate an uptrend, while readings below 50 signal a downtrend. The farther the RSI gets from the 50 level, the stronger the trend.
For instance, if a currency pair has an RSI around 40, it shows a strong downtrend. But if the RSI moves up to 60, it indicates the downtrend is losing steam and a reversal may be near.
Divergence
Divergence forms when the RSI and price action are moving in opposite directions. This discrepancy usually precedes a trend reversal.
If prices are making new highs but the RSI is failing to exceed its previous highs, it signals bearish divergence. This warns that buying momentum is waning. The opposite is true for bullish divergence.
Failure Swings
A failure swing occurs when the RSI exceeds a previous high or falls below a previous low. This predicts that prices are likely to reverse course in the near future.
For example, if the RSI on a stock drops below its prior low of 30, it signals failure and that a bounce higher may be imminent.
Support and Resistance
The RSI often respects key support and resistance levels like 30, 50, and 70. The RSI bouncing near 30 or 70 can act as a forewarning of a trend reversal.
Traders also watch for the RSI to break above or below prior highs and lows, hinting at a shift in momentum.
Trading Strategies Using the Relative Strength Index
The RSI indicator offers endless possibilities when it comes to designing trading strategies. Here are some of the most common and effective ways to use the RSI:
Overbought/Oversold Reversals
This straightforward approach involves looking for the RSI to hit overbought or oversold levels and then waiting for the inevitable reversion back to more reasonable levels. Going counter to extremes can produce profitable mean reversion trades.
The key is waiting for confirmation of the actual reversal with a candlestick pattern or other indicator signal rather than blindly selling overbought conditions.
Divergence Trades
Spotting bullish or bearish divergence between the RSI and price action can tip traders off to an impending trend reversal. Divergence trades try to capitalize on these high probability turnarounds.
It’s generally best to wait for confirmation of the divergence with a break of support or resistance. RSI divergence alone doesn’t always lead to an immediate reversal.
Trend Trading Pullbacks
Trend traders often use the RSI to identify pullbacks within the overall trend. Oversold readings in an uptrend or overbought levels in a downtrend can signal opportunities to trade retracements.
The key is sticking to the prevailing trend direction and using overextended RSI levels to time entries and exits. For example, buying when the RSI pulls back near 30 in an uptrend.
Breakout Trading
Since the RSI frequently tops or bottoms ahead of prices, it can be used to anticipate breakouts. An RSI break above 70 warns of a potential upside breakout, while a drop below 30 signals prices may soon break support.
Combining RSI signals with other indicators like moving average crosses can further validate breakout trades. Always employ sound risk management with stop losses when trading breakouts.
Swing Trading
The RSI’s ability to identify reversals makes it extremely useful for swing trading. Traders use the indicator to help determine entry and exit points, as well as assess the overall trend on higher time frames.
Watching for oversold readings near 30 on weekly or monthly charts can identify the larger trend, signaling potential long-term trades. The RSI is particularly helpful on swing trades for its early reversal warnings.
Best Practices When Using the RSI Indicator
Here are some tips for applying the RSI indicator effectively:
- Use it in combination with other technical indicators for confirmation. The RSI alone often produces false signals.
- Adjust the lookback period from the default 14 to suit your style. Shorter periods like 7 work well for active traders.
- Consider oversold/overbought levels of 80/20 or 90/10 for more extreme trending markets like commodities or crypto.
- Play around with RSI settings on various time frames to determine the most useful readings for your strategy.
- Avoid trades when the RSI is between 40 and 60, which signals indecision and choppy conditions.
- Be flexible in your interpretation, as the RSI works differently on various instruments in certain market conditions.
- Trade in the direction of the major trend when using the RSI for counter-trend signals.
Common Questions and Misconceptions
Here are answers to some frequently asked questions about the RSI indicator:
What time frame works best for RSI?
The RSI is effective on all time frames. That said, it works exceptionally well for swing trading on the 4-hour, daily, and weekly charts. The default 14-period RSI matches up well with these time frames.
Does overbought automatically mean it’s time to sell or go short?
No. An overbought reading is not an outright sell signal; it indicates the potential for a reversal, but confirmation is required through other means like candlestick patterns or further RSI weakness.
What if the RSI stays overbought or oversold for long periods?
Extended overbought or oversold readings lasting many weeks demonstrate an incredibly strong trend. It’s best not to fight the trend and look for RSI pullbacks to join the momentum.
Why doesn’t the RSI line up perfectly with highs and lows in price?
The RSI is a smoothed indicator, so its swings will not align perfectly. Also, the RSI leads price action, so divergences naturally occur. Perfection between the RSI and price activity is not expected.
Does the RSI work better in ranging or trending markets?
The RSI adapts well to all market conditions. It works best for trend trading during sustained trends and for mean reversion in range bound markets.
Conclusion
As one of the most popular and flexible technical indicators, the RSI should be a staple in every active trader’s charting toolbox. While not a crystal ball, the RSI provides invaluable clues into trend strength, reversals, breakouts, and retracements.
Use this guide to understand the key concepts of overbought/oversold levels, divergences, and failure swings. Experiment with combining the RSI with price action patterns and other indicators. Adjust the lookback period and overbought/oversold levels to best fit your trading style.
Always remember that any indicator like the RSI is just a tool. Develop solid risk management habits and never rely solely on RSI readings. With the right approach, the relative strength index can greatly enhance your trading process and bolster your bottom line.