
The moving average of oscillator (MAO) is a technical indicator used in financial markets to identify trends and momentum. This oscillator uses two moving averages – a longer-term and a shorter-term moving average – to generate trading signals.
The MAO is a powerful tool that traders can use to determine overbought and oversold conditions in the market. By analyzing the relationship between the two moving averages, traders can identify potential reversals and ride new trends as they emerge.
In this comprehensive guide, we will explore everything you need to know about the moving average of oscillator, including:
What is the Moving Average of Oscillator?
The moving average of oscillator is a momentum indicator that uses the difference between two moving averages to generate overbought and oversold trading signals.
Specifically, the MAO calculates the difference between a longer-term moving average (such as 50 periods) and a shorter-term moving average (such as 10 periods). The values of this difference oscillate above and below a centerline at zero.
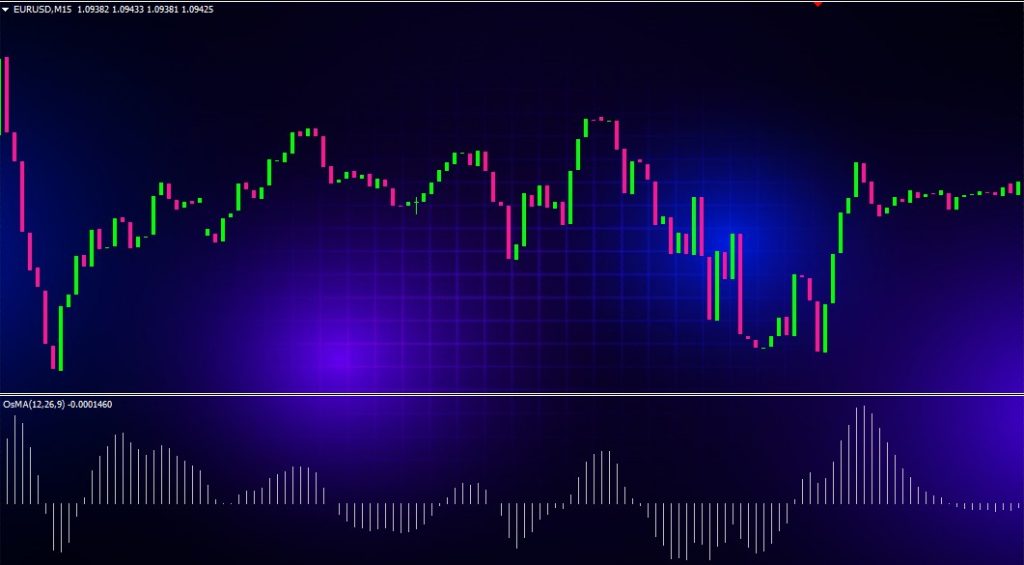
When the shorter moving average moves above the longer moving average, the MAO line will move above zero to indicate increasing positive momentum. Conversely, when the shorter MA trades below the longer MA, the MAO line will drop below zero to signal increasing negative momentum.
By identifying these swings in momentum from positive to negative or vice versa, traders can spot potential trend reversals to capitalize on. The MAO is therefore a leading indicator of trend changes.
How is the MAO Calculated?
The formula for calculating the moving average of oscillator is:
MAO = Shorter-Term MA – Longer-Term MA
Where:
- Shorter-Term MA = The shorter moving average period (e.g. 10 periods)
- Longer-Term MA = The longer moving average period (e.g. 50 periods)
For example, if using a 10-period and 50-period moving average:
MAO = 10-period MA – 50-period MA
The values of this difference will oscillate above and below the zero line, allowing traders to spot swings in momentum.
Key Features of the Moving Average of Oscillator
Here are some key features of the MAO indicator:
- Oscillates around a zero line – Values swing above and below 0 to indicate momentum shifts. This allows easy identification of overbought/oversold levels.
- smoothed indicator – By using moving averages in its calculation, the MAO smooths out price fluctuations to show clearer momentum trends.
- Leading indicator – The MAO generates early signals of potential trend changes by analyzing moving average crossovers. It is therefore leading rather than lagging.
- Easy to interpret – Traders simply look for zero line crossovers and momentum shifts to find trading opportunities. Clear overbought/oversold signals.
- Flexible inputs – The two moving average periods can be adjusted to suit different trading objectives, markets and timeframes.
- Works on all timeframes – The MAO can be used for day trading, swing trading or longer-term positional trading on weekly/monthly charts.
As you can see, the MAO packs a lot of helpful features into one indicator. Next, we’ll explore how to actually use the moving average oscillator in trading.
How to Use the Moving Average of Oscillator in Trading
The MAO produces clear trading signals that can be incorporated into a broader trading approach. Here are the main signals to look for:
Overbought/Oversold Levels
Perhaps the most common way to trade the moving average oscillator is to identify overbought and oversold levels.
The MAO is overbought when it rises significantly above +100. This signals positive momentum may be peaking. The MAO is oversold when it falls substantially below -100, signaling momentum may be bottoming out.
These extreme highs and lows indicate the potential for a trend reversal. Traders would look to enter counter-trend trades when the MAO reaches extremes.
For example, if the MAO rises to +150 (overbought territory), traders would consider a short position to capitalize on potential downward momentum. The opposite applies for oversold readings below -150.
Zero Line Crossovers
The zero line acts as a key threshold for the MAO. When the MAO crosses above zero, it signals upside momentum is strengthening. A cross below zero signals downside momentum is increasing.
These zero line crossovers can be used to identify new emerging trends. Traders would buy when the MAO crosses above zero and sell when it crosses below zero.
Divergences
The MAO can also be used to spot bullish and bearish divergences with price:
- Bullish divergence – Price makes lower lows while the MAO forms higher lows. This suggests downside momentum is slowing, and an upside reversal may be near.
- Bearish divergence – Price makes higher highs while the MAO forms lower highs. This signals upside momentum is fading, and a downturn may be ahead.
Analyzing divergences allows traders to anticipate potential trend changes ahead of the price curve.
By combining these various signals, traders have multiple opportunities to detect trend reversals and entries using the MAO indicator.
MAO Trading Strategy Example
Here is a simple MAO trading strategy in action:
- Configure the MAO with standard inputs (e.g. 10-period and 50-period moving averages). Apply to a price chart.
- Identify overbought/oversold levels – Look to buy when the MAO crosses below -100, and look to sell when it crosses back above +100.
- Take zero line crossover trades – Buy when the MAO crosses above zero and sell when it crosses below.
- Watch for bullish/bearish divergences with price.
- Place stop losses below key swing lows or above key swing highs. Trail stops to lock in profits as the trade moves in your favor.
- Target a risk/reward ratio of at least 1:2 on all trades.
This demonstrates how the MAO can be easily integrated into a complete, rules-based trading plan for both entries and exits. The MAO provides the trade signals, while sound risk management takes care of the rest.
Now let’s dive into optimizing the key settings when configuring the moving average oscillator.
Optimizing MAO Settings
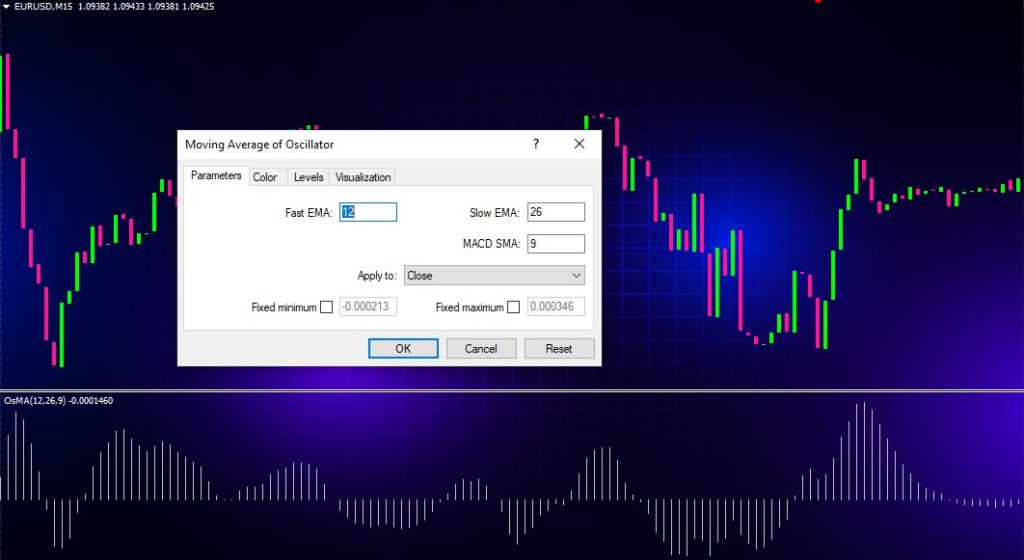
The MAO has two main settings that can be adjusted:
- Shorter moving average period
- Longer moving average period
Let’s explore how tweaking these affects the indicator:
Shorter MA Period
The default shorter MA period is often set to 10. Lower values will make the MAO more sensitive to minor price swings. Higher values will smooth out the oscillator.
Active traders may opt for a shorter period like 6 to generate more frequent trading signals. Investors using the MAO on long timeframes may prefer longer periods like 20 or 30 to avoid excessive noise.
Longer MA Period
The standard longer MA period is 50. Lower values will make the MAO more responsive to price fluctuations. Higher values will create a smoother oscillator.
Aggressive traders might test shorter long periods around 20. For long-term trends, longer periods like 100 or 200 can filter out background noise.
Fine Tuning Parameters
To fine tune the MAO, experiment with different short and long periods to match your goals. Some examples:
- Day trader – Short MA 6, Long MA 20
- Swing trader – Short MA 10, Long MA 50
- Investor – Short MA 30, Long MA 200
The optimum settings will depend on the market, timeframe and your style. The parameters can be adjusted over time to adapt to changing conditions.
Using MAO Across Timeframes
The MAO can also be applied to multiple timeframes for a complete view of momentum. For example:
- Monitor the daily chart for the overall trend bias
- Use the 4-hour MAO for swing trade entries
- Consult the 1-hour chart for dynamic support/resistance levels
- Refer to 15-minute chart for timing day trades
Adjust the inputs on each timeframe accordingly. This multi-timeframe approach allows you to benefit from the MAO across short-term and long-term perspectives.
Combining the MAO with Other Indicators
For added trading confirmation, the moving average oscillator can be combined with these complementary indicators:
Moving Averages
Plot moving averages like the 20 and 50-period. The MAO signals momentum shifts, while the MAs identify dynamic support and resistance. Enter MAO trades that align with the prevailing MA trend.
Price Oscillators
Oscillators like the RSI can confirm overbought/oversold readings. For example, look for MAO extremes close to RSI extremes for higher probability trades.
Chart Patterns
Look for MAO signals to emerge from chart patterns like triangles, flags or wedges. The MAO helps time entry, while the pattern defines risk/reward.
Candlestick Signals
Candlestick patterns like bullish engulfing or shooting stars can further bolster MAO trade signals. This combines Western and Eastern technical techniques.
By pairing the MAO with additional indicators, traders can develop a robust, multi-layered trade setup for greater precision.
Common Questions About the Moving Average Oscillator
Here are answers to some frequently asked questions about the MAO:
What’s the best MAO setting for day trading? For day trading, try shorter periods like a 5-day short MA and 15-day long MA. This captures short-term momentum swings for active intraday traders.
Can the MAO be used on forex, crypto, stocks, etc? Yes, the versatile MAO works on all liquid markets including forex, cryptocurrencies, stocks, commodities, ETFs and indices. Adjust the inputs as needed per instrument.
Does the MAO repaint? No, the MAO does not repaint, meaning past values are not recalculated. Like all standard indicators, it strictly analyzes price history.
What trading platform offers the MAO indicator? Popular platforms like MetaTrader 4/5, TradingView, NinjaTrader and Sierra Chart support the MAO. It can be easily added to the chart.
What’s the main weakness of the MAO? No single indicator works perfectly in isolation. The MAO may not integrate broader technical or fundamental conditions. Combining it with other analysis is recommended.
These are just some quick tips for applying and optimizing the moving average oscillator in live markets. Let’s now summarize the key points covered.
Conclusion – Applying the MAO Indicator Skillfully
The moving average oscillator is a robust momentum indicator that identifies overbought/oversold levels and trend reversals ahead of the curve. Here are the key takeaways:
- Calculates difference between a short and long moving average
- Oscillates above/below zero line to signal momentum shifts
- Values above +100 indicate overbought conditions, while readings below -100 signal oversold levels
- Traders look for zero line crossovers, divergences and extremes for trades
- Adjust short/long moving average periods to suit your style and time frame
- Confirm signals with other indicators like moving averages and oscillators
- Use on multiple timeframes to gain a multi-dimensional view of momentum
With the strategies outlined in this guide, you now have an actionable framework for effectively applying the moving average oscillator in your own trading. Use the MAO to capitalize on trend reversals as momentum shifts from positive to negative.
The MAO delivers high-probability trading signals – if you use it prudently alongside sound analysis and risk management.