
Momentum indicators are some of the most popular technical analysis tools used by forex traders. The momentum indicator calculates the speed and strength of price movements, allowing traders to identify new trends and potential reversals in the market. In this comprehensive guide, we’ll explore what momentum indicators are, how they work, and how traders can incorporate them into their trading strategies.
What is Momentum in Forex Trading?
Momentum measures the rate of acceleration of price movements in a security like a currency pair. It allows traders to identify emerging trends, gauge trend strength, and anticipate potential trend reversals earlier than just monitoring price action alone.
In physics, momentum is calculated by multiplying an object’s mass by its velocity. The greater the velocity of an object, the greater its momentum. This core principle is applied to trading momentum indicators. Price changes are equivalent to the velocity of security prices. Strong moves in either direction signal high momentum, while slow-moving prices have low momentum.
Why Momentum Matters in Forex
Momentum helps traders confirm price trends and recognize shifts that could evolve into new trends. Analyzing momentum patterns and indicators provides trading signals and assists with:
- Identifying New Trends Early – Increased momentum typically precedes major trends. Monitoring momentum indicators can pinpoint trends in their infancy.
- Assessing Trend Strength – The speed of price swings reveals the underlying strength or weakness of a trend. Strong momentum reflects market enthusiasm which leads to stronger trends.
- Spotting Divergences – Comparing price action to momentum indicators reveals divergences hinting at impending trend changes.
- Defining Overbought/Oversold Levels – Extreme momentum readings above or below normal ranges suggest overbought or oversold conditions.
- Confirming Trend Reversals – Declining momentum typically precedes trend reversals as enthusiasm wanes. Watching for momentum shifts helps traders prepare for reversals.
In essence, momentum helps traders objectively assess the driving forces behind emerging or mature trends. By quantifying price velocities, momentum indicators filter out market noise and focus on the speed of underlying price movements.
Types of Momentum Indicators
Many different technical indicators gauge momentum. The most common momentum indicators used in forex trading include:
Moving Average Crossovers
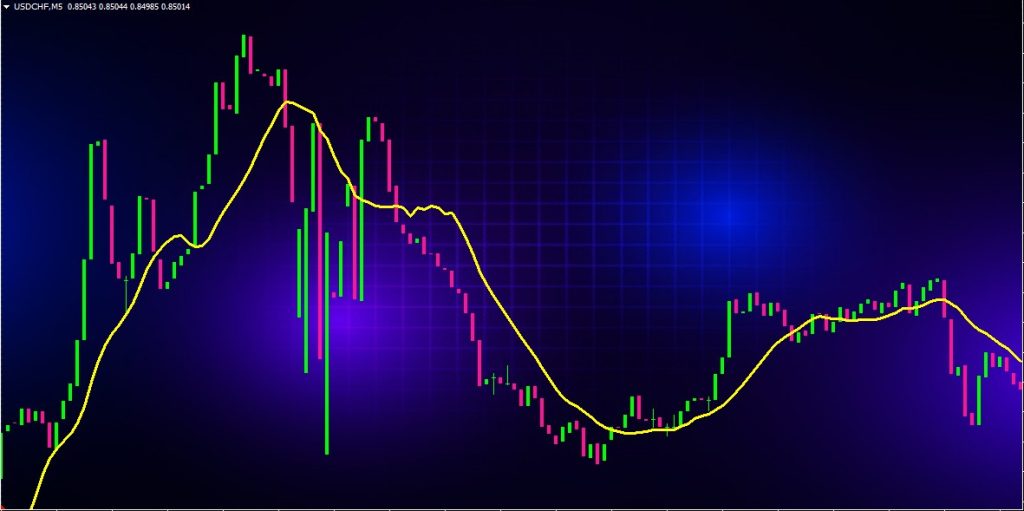
Two moving averages of different periods crossing over signals momentum shifts. The 50-period and 200-period simple moving averages are most commonly used for forex trading. A 50 SMA crossing above a 200 SMA signals rising momentum and an uptrend.
Rate of Change (ROC)
The Rate of Change indicator calculates the percentage difference between the current price and closing price from a specified number of periods ago. The greater the ROC value, the stronger the momentum. Positive ROC values signal upward momentum while negative values indicate downward momentum.
Relative Strength Index (RSI)
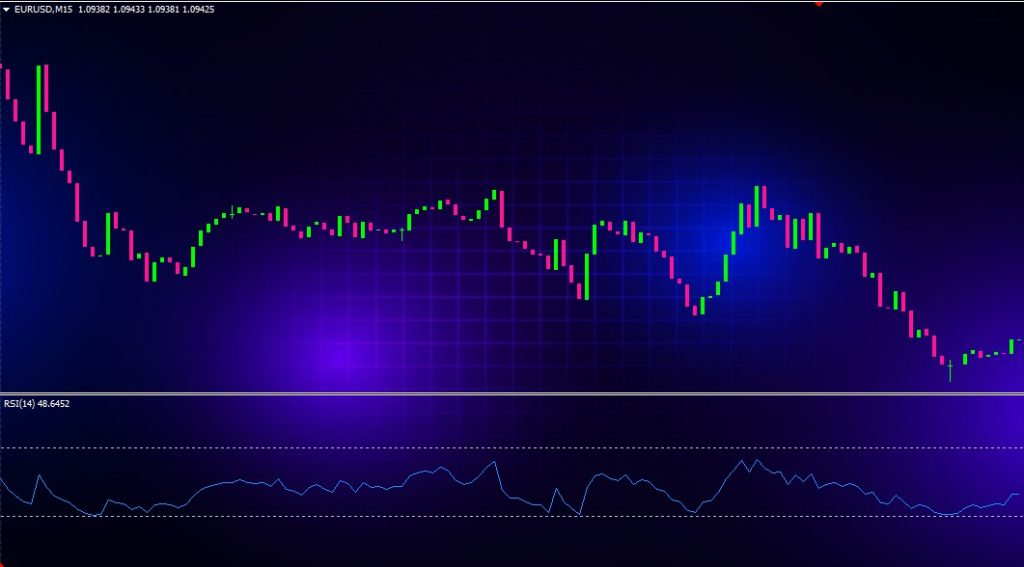
The Relative Strength Index compares the average price gains with average losses over a set period. RSI values range from 0 to 100. Values above 70 signify overbought conditions and below 30 indicate oversold conditions. As RSI approaches these extremes, it signals fading momentum.
Stochastic Oscillator
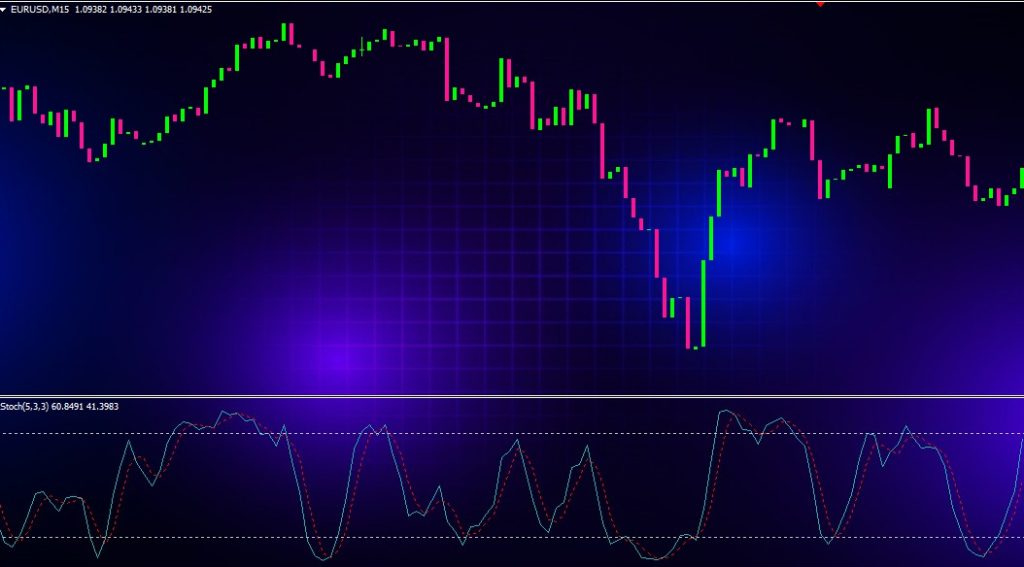
This momentum indicator uses two lines called %K and %D to pinpoint overbought/oversold levels. It measures where the close sits in relation to the high/low range over a defined lookback period. When the %K line crosses above 80, it signals overbought conditions, while %K crossing below 20 signifies oversold conditions.
Commodity Channel Index (CCI)
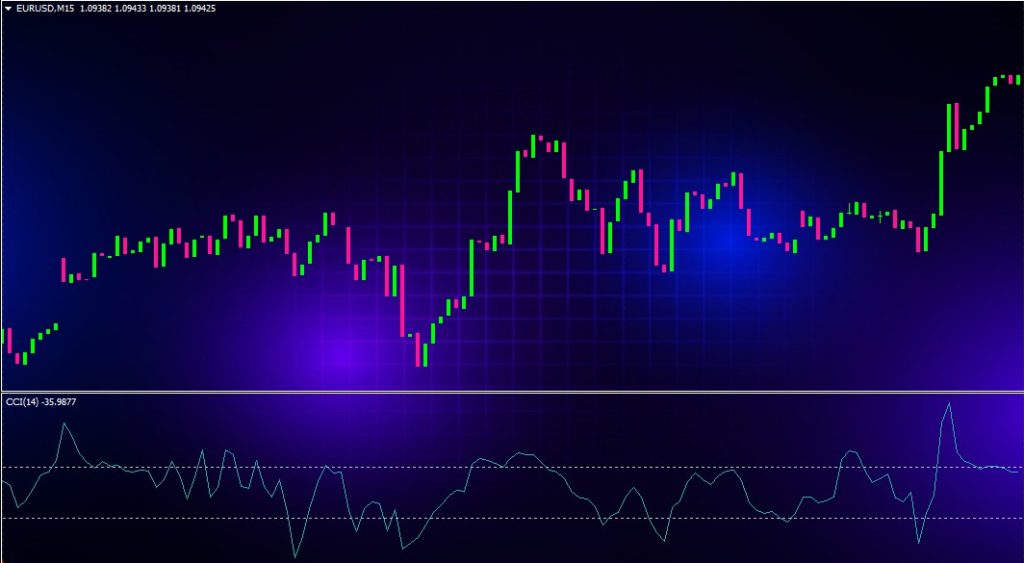
The CCI indicator measures price deviations from its statistical mean. Readings above 100 signal an overbought market while readings below -100 indicate an oversold market. The CCI highlights extreme momentum levels well before overbought/oversold signals.
Moving Average Convergence Divergence (MACD)
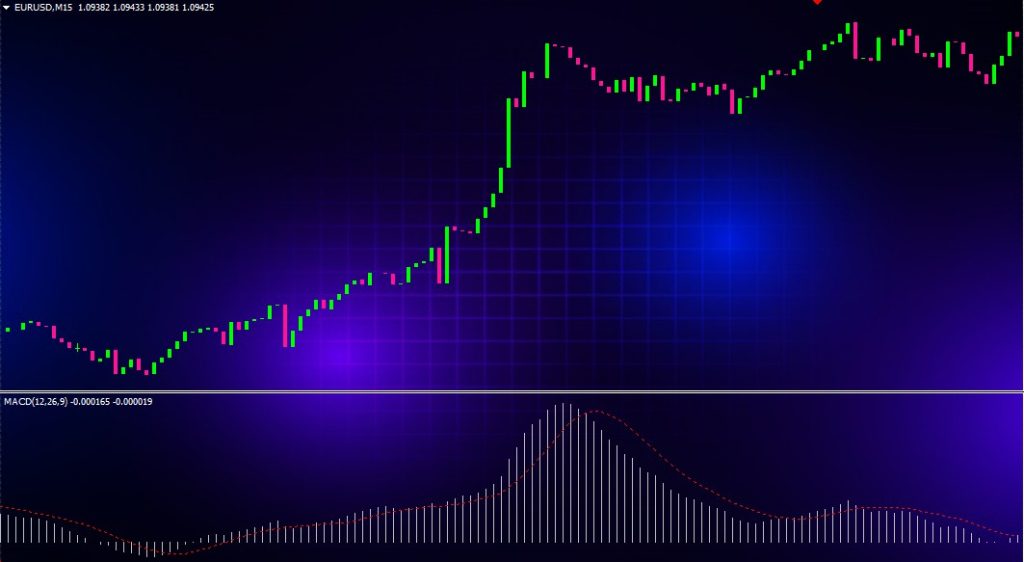
The MACD tracks the relationship between two exponential moving averages. Crossovers, centerline crossovers, and divergences in the MACD lines produce momentum trading signals. MACD also incorporates a histogram visualizing the distance between the MACD and its signal line to highlight momentum.
Average Directional Index (ADX)
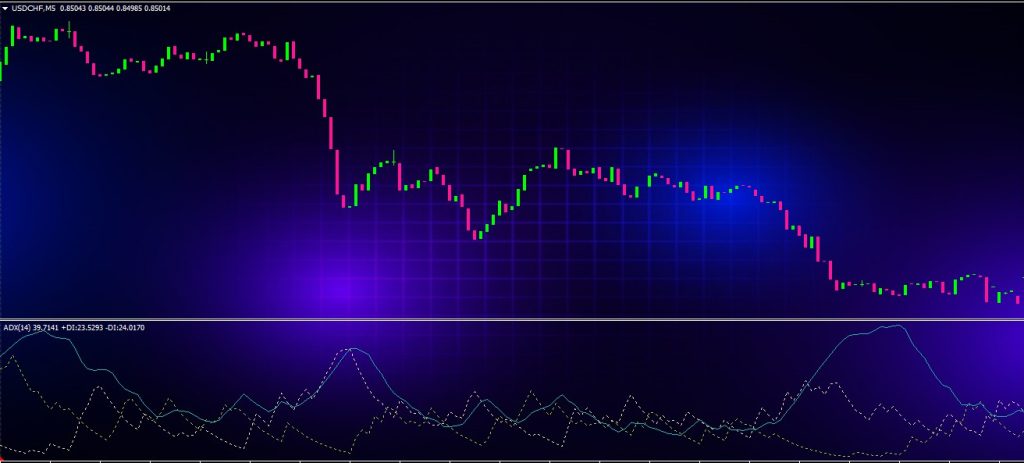
The ADX measures trend strength without factoring the trend’s direction. It consists of three lines – the ADX, +DI, and -DI. Higher ADX values signal stronger momentum while readings below 25 reflect no clear trend. The +DI and -DI reveal the direction of the momentum/trend.
How Momentum Indicators Work
While momentum indicators use varied formulas, they all interpret velocity and strength of price movements. Here is an overview of how common momentum indicators function:
Relative Strength – Comparing Gains vs Losses
Oscillators like RSI and Stochastic derive momentum from relative strength analysis – comparing periods of price gains to periods of losses. Gains extending higher than preceding losses show increasing upward momentum, while losses exceeding previous gains signal downward momentum is intensifying.
Smoothed Moving Averages – Crossover Signals
Moving average crossovers produce momentum signals by smoothing out price action into more easily interpreted directional signals. The 50 SMA crossing above the 200 SMA signals improving momentum. The farther apart the moving averages spread, the stronger the momentum.
Rate of Change – Accelerating Price Moves
Indicators like ROC quantify momentum as the speed of changing prices. More dramatic price changes in either direction over a specified lookback period produce stronger positive or negative momentum readings. Milder ROC readings signal waning momentum.
Overbought/Oversold Levels – Extremes in Momentum
Momentum oscillators highlight overbought or oversold conditions to identify unsustainably high or low momentum. These situations often arise before reversals when momentum is peaking. RSI, Stochastic, and CCI oscillators identify these temporary extremes based on normal momentum ranges.
Divergences – Disconnections Between Price and Momentum
Price divergences from momentum reflect shifts in the balance of buying/selling power. Price extending higher while momentum declines signals waning upside momentum. Fading downward momentum as price drops can foreshadow bullish trend reversals.
Using Momentum Indicators in Forex Trading Strategies
Momentum indicators have a wide range of applications for forex trading strategies depending on the trader’s goals, style, and timeframes. Here are some of the most common uses of momentum indicators:
Confirm Trend Strength
Monitoring momentum indicator directionality confirms the strength of existing trends. Uptrends display rising momentum indicators like positive sloping moving averages or RSI holding above 50. Downtrends exhibit falling momentum indicators.
Identify Trend Exhaustion
Look for momentum indicators straying into overbought or oversold zones to anticipate trend exhaustion. For example, RSI levels above 70 signal an uptrend may have little momentum left, increasing odds of a reversal.
Time Trend Reversals
Combining momentum indicators that signal ahead of reversals can help time turns precisely. Oscillators reaching extremes can flag reversals 1-3 periods before confirmation from a moving average crossover.
Define Support/Resistance Areas
Plotting momentum indicators like MACD or RSI shows zones that previously triggered reversals. These momentum indicator levels mark support/resistance to watch for bounces.
Gauge Retracement Severity
Measuring momentum indicator movements compared to price counter-trends determines retracement severity. Mild momentum dips signal normal pullbacks while sharp momentum drops can foreshadow deeper corrections.
Filter Out False Breakouts/Breakdowns
Comparing price breakouts to momentum readings authenticates true breakouts. Breakouts confirmed by rising momentum are more durable versus false breakouts with deteriorating momentum.
Identify Divergences
Monitoring for price/momentum divergences provides advanced reversal signals. RSI remaining flat while price rises flags diminishing upside momentum. MACD declining as price rises also highlights bearish divergence.
Set Profit Targets
Momentum indicators reach extremes at oversold/overbought thresholds. These exhausted momentum levels indicate logical profit targets. RSI near 80 offers reasonable long profit targets while RSI around 20 presents short profit target zones.
Best Practices for Trading with Momentum
While momentum indicators seem straightforward, traders should employ disciplined analysis and concrete trading rules to avoid common pitfalls:
Combine Momentum with Price Action
Price action provides context for momentum readings. Only take trades in the overall trend direction confirmed by price action, not solely based on momentum indicators.
Use Multiple Momentum Indicators
Comparing momentum signals from different indicators provides reliable confirmation. Initiating trades when two or more momentum indicators align lowers risk.
Define Extreme Levels
Determine precise overbought/oversold levels based on historical data versus relying on default indicator settings. This avoids premature or late momentum signals.
Focus on Clear Divergences
Do not over-react to minor price/momentum divergences which occur frequently. Wait for clear divergences persisting over 3-5 periods at least.
Implement Momentum with Other Indicators
Add additional technicals like trendlines or chart patterns to improve timing and add confidence for momentum trades. Momentum indicators alone often generate false signals.
Consider Timeframes
Momentum indicators provide different insights on smaller vs. larger timeframes. Multi-timeframe analysis reduces false signals and highlights the most consistent high probability setups.
Common Momentum Trading Strategies
Here are some sample momentum trading strategies combining momentum indicators with confirmation technicals:
Moving Average Crossover Pullback
- 50 SMA crosses above 200 SMA confirming new uptrend
- Price retraces to the new moving average support
- Enter long on completion of pullback
Set stop loss below 50 SMA and take profit near overbought RSI readings
Oversold RSI Bounce
- RSI falls below 30 signaling oversold reading
- Price bounces off a support zone like prior swing low
- Enter long when RSI diverges higher from support bounce
- Place stop loss below support and target overbought RSI area
MACD Histogram Fade
- MACD histogram spikes above zero signaling momentum acceleration
- Fading MACD histogram signals momentum slowing
- Enter short as histogram prints first negative bar after spike
- Set stop above previous high and profit target near MACD zero line
Double Moving Average Cross
- 50 SMA sustains above 200 SMA confirming uptrend
- 20 SMA breaks above 50 SMA showing new momentum acceleration
- Enter long on moving average crossover with stop under 50 SMA
- Target resistance zone using trailing stop once above entry
Stochastics Overbought Cross
- %K stochastic line breaks above 80 signaling overbought conditions
- Look for %K line to cross back below 80 indicating overbought momentum exhaustion
- Enter short on crossover with stop loss above %K highs
- Close trade as %K drops back below 20 oversold threshold
Conclusion
Momentum indicators provide objective, easily-readable inputs for assessing emerging or ongoing trends. By quantifying the speed and strength of price movements, momentum metrics help traders verify true trend shifts versus noise and improve timing on entries and exits.
While momentum indicators alone have limitations, combining them with other technical indicators, price action context, and risk management strategies allows traders to capitalize on high probability momentum trading opportunities. Implemented properly, momentum can be a critical component of consistently profitable forex trading systems.