
Understanding supply and demand dynamics provides a profound analytical edge for savvy forex traders anticipating market turns. Even beginners gain instant profits trading key supply/demand levels after grasping some simple concepts.
In this extensive guide, you’ll discover:
- What supply/demand zones reveal and how they form
- Identifying key S/D levels manually like a pro
- Powerful MT4 supply/demand indicator introduced
- High-probability trading strategies from S/D zones
- Tips from experts to elevate your analysis
- Who benefits most from supply/demand trading
Let’s dive in exploring the immense power behind supply and demand zone analysis!
What Are Supply and Demand Zones on Charts?
Supply refers to the amount of currency pair shares liquidity providers like banks have available to meet buying demand at various prices.
Demand shows the existing level of buying interest for a currency pair at certain prices.
Imbalances lead to characteristic chart patterns:
Excess supply zones form after extended advances when eager buyers dry up but sellers remain flooding the market with more shares than buyers want, sparking selloffs from extreme peak levels. This indicates temporarily misalignment where supply outpaces demand.
Excess demand zones create support areas where burst of buying demand eagerly absorbs all available shares, propelling prices higher until demand satisfies. More interested buyers than sellable inventory produces these hot demand zones.
In essence, visible S/D zones reflect shifts in crowd optimism/pessimism cycles. Buyers aggressively bid prices higher during uptrends, eventually exhausting themselves allowing sellers to take control causing corrections. This continues until demand resurges when prices drop sufficiently.
Learning to properly analyze this interplay between buyers and sellers makes you an informed trader ready to profit from visible zones of excess supply and demand. Even years later, price respects these precise areas where buying/selling pressure went extreme.
Here is a simple tip for trading the supply and demand indicator:
Combine the indicator on the daily chart with price action reversals on smaller timeframes at the exact zones for precision entries.
Manually Identifying High-Probability Supply and Demand Zones
While manually scanning charts for S/D zones takes skill only built from extensive practice, doing this hard work pays learning dividends enabling you to spot these trades instantly later after developing a trained eye.
What clues to look for when identifying emerging zones:
- Accelerated price towards level as urgency builds
- Divergence from moving averages means control shift
- Extreme highs/lows indicates unsustainable pressure
- Rejection and bouncing from the level numerous times after
Follow these precise steps to draw accurate zones like an experienced pro:
- Spot acceleration, divergence, extremes in price action
- Pinpoint exact swing points where direction changes
- Draw horizontal support/resistance precisely at turn points
- Refine high-probability zone areas using wick boundaries
With dedicated chart screen time, you’ll quickly master properly identifying and drawing key S/D imbalance zones giving you an edge over retail traders lacking this skill.
Powerful MT4 Supply and Demand Zones Indicator
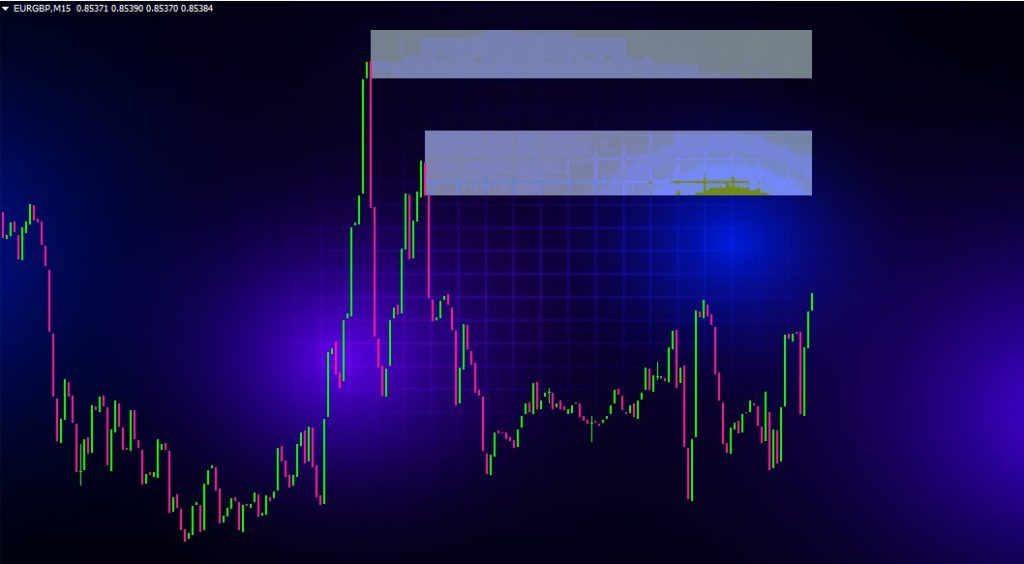
Thankfully traders no longer need to manually draw zones spending long tedious hours analyzing every price level across years of charts searching for clues thanks to the specialized indicator highlighting historical S/D zones automatically!

This custom tool utilizes an advanced algorithm scanning price history identifying precise areas where supply exceeded demand signaling tops or demand overwhelmed supply signaling bottoms that propelled sustained directional moves.
Notable benefits gained from using the supply/demand zone indicator:
- Eliminates tedious manual supply/demand analysis
- Backtests entire chart history accurately visualizing zones
- Dynamically updates emerging zones in real-time
- Easily customizable settings matching preferences
- Works flawlessly across all currency pairs and timeframes
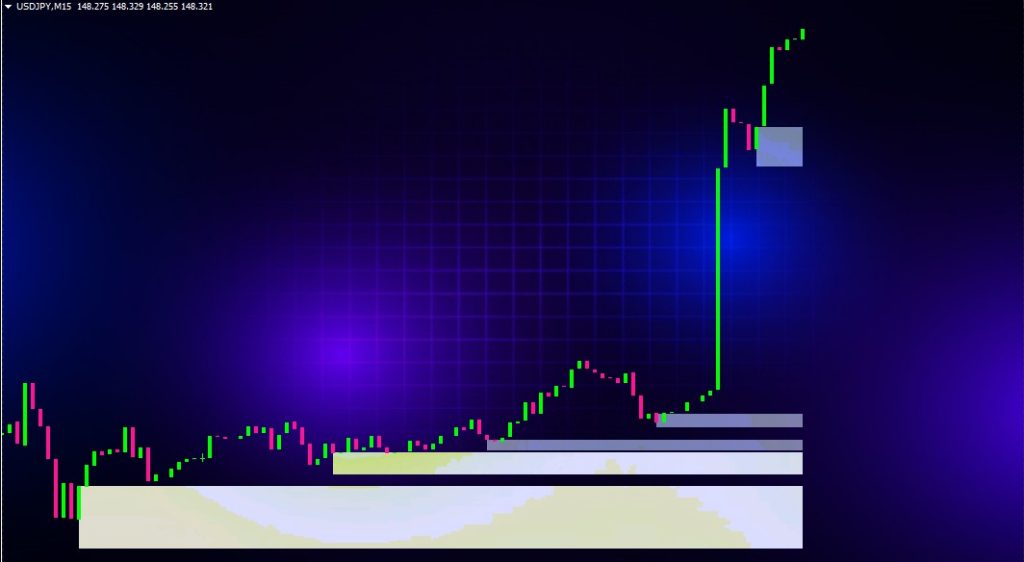
- Color-codes zone types indicating retests
The indicator offers tremendous value revealing at-a-glance past buying/selling pressure extremes that shaped market direction – with these zones now automatically plotted for you to focus analysis only on the highest-probability zones.
Trading Strategies to Profit from Supply and Demand Zones
Trading signals flash with increased probability when price reaches backtested supply or demand zones revealed through advanced algorithms making strategy rules straightforward.
Let’s examine two simple yet highly profitable setups to trade these levels.
Reversals
Key rules for counter-trend setups:
- Identify fresh untested supply/demand levels
- Wait for confirming candle close returning into zone
- Enter trade at zone edge in opposite direction
- Place protective stop-loss just beyond zone
- Target 1:1 risk-reward ratio or higher
Breakouts
Trading accelerations in existing momentum direction:
- Find supply/demand zones aligned with trend
- Enter as price breaks out of zone with force
- Stop-loss goes opposite side of zone
- Target wider profit vs. risk ratios like 1:2+
Elevate Analysis Using Multi-Timeframe Confluence Zones
While trading signals clearly flash at backtested zones, accuracy and profitability enhances applying these advanced analysis tips from pro traders:
- Monitor higher timeframes revealing strongest S/D zones
- Focus only on zones aligning with round numbers like 1.3000
- Add momentum oscillators like RSI for additional trade confirmation
- Watch for diminishing zone power after 5+ retests
- Big fundamental news can temporarily negate technicals
Remember, institutional traders and algorithms use supply/demand analysis to identify key market inflection points. Now you have access to similar technology!
Who Benefits Most from Trading Supply and Demand Zones?
A major advantage of supply/demand trading comes from its versatility fitting all trader types and style approaches benefiting both beginners and experienced veterans alike.
Key benefits for beginners:
- Simple entry rules – buying at demand, selling at supply
- Limited screen time needed since zones visibly stand out
- Easy to understand logic not overloading with complex indicators
Benefits for experienced traders:
- Rapidly reveals potential zones missed manually
- Confirms your analysis for greater confidence/conviction
- Enhances any current rule-based trading strategies
Intraday scalpers use smaller timeframes targeting quick profits while swing traders select higher timeframe zones to capture larger moves.
Regardless of one’s experience level or strategy type, applying supply/demand zone techniques lifts performance substantially.
Check out our socials: Instapaper, Lasso, Start.Me and Dailygram
Conclusion
Hopefully you now grasp why mastering supply/demand analysis and trading belongs in every serious trader’s toolkit. Whether you trade zones manually spotted or incorporate indicators pinpointing and plotting these high-probability areas automatically, the edge is profound. By incorporating these dynamics governing visible supply/demand imbalances on charts into your current approach, expect strategy win rates and profitability metrics to soar.
So commit now to elevating your trading by leveraging the immense power of supply and demand zones!
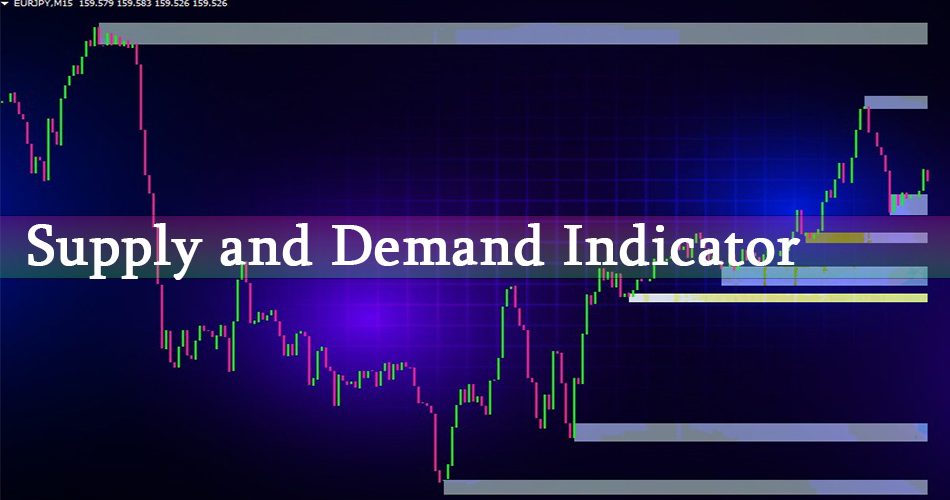
Supply and Demand Zones Indicator
supply and demand zones indicator offers a better visual of what's going on in the financial markets. These sell and buy zones are opportunities
Application Category: MT4 Indicator
4.5